A distributor with a 22% gross margin does not need a disaster to lose money. It only needs a price list that is two weeks behind supplier costs, a few reps who round discounts in the customer's favor, and three versions of the same PDF floating around in customer inboxes. Those are the B2B price list mistakes that quietly eat profit, and most teams never see them on a single report. This article walks through the most expensive ones, shows what they cost, and gives you a fix for each. Along the way we will look at how a tool like Flipbooks AI helps you keep one living price list instead of a pile of stale files.
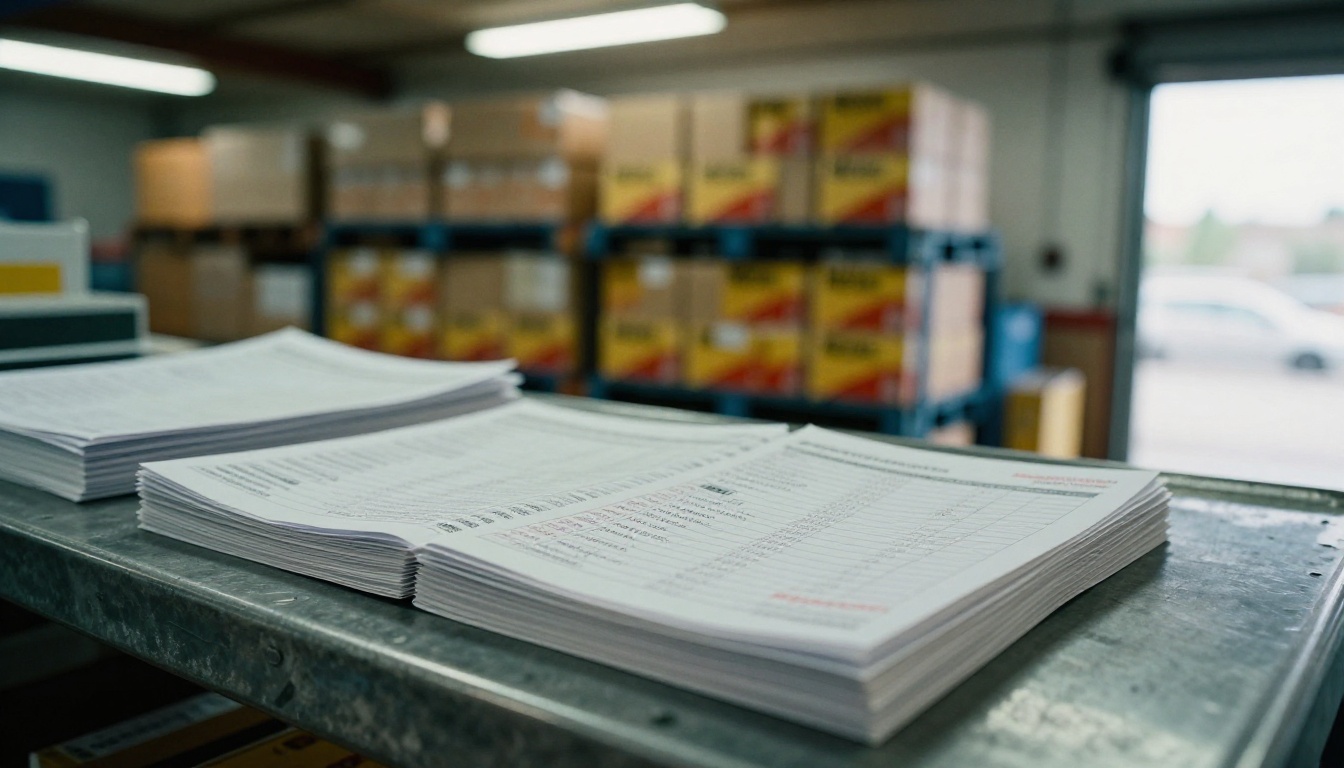
Why Small Leaks Add Up
Margin leakage rarely looks like a loss. It looks like a normal order. A customer buys 40 cases, the rep applies "the usual" discount, the invoice goes out, and nobody checks whether the price still clears the landed cost.
Consider a distributor with $12 million in annual revenue. If pricing errors shave just 1.5 points off margin, that is $180,000 a year gone, with no extra sales effort required to recover it. A single point of price realization is usually worth more than a 5% increase in order volume.
The leaks tend to cluster in a few places:
- Costs that changed but prices did not
- Discount tiers nobody can explain
- Multiple versions of the list in circulation
- Special deals that never expire
- Freight, surcharges and fees left off the list
- Unit-of-measure confusion
Let's take them one at a time.
The Hidden Cost of "Good Enough"
Most distributors know their list is imperfect. They accept it because a full price review takes weeks. The trouble is that "good enough" compounds. Each SKU that sits two cost cycles behind costs you a little on every line, every day.
💡 Pro tip: Rank your SKUs by annual units sold, then audit the top 20% first. That group typically carries 70% to 80% of your volume, so each correction pays back quickly.
Mistake 1: Stale Costs, Fresh Prices
This is the biggest leak by far. A supplier raises costs by 4%, your purchasing team gets the notice, but the price list still shows last quarter's numbers. Every unit sold in the gap ships at a thinner margin.

What It Looks Like in Practice
A plumbing supply distributor receives a 6% increase on copper fittings effective on the first of the month. The ERP updates cost immediately. The customer-facing price list, maintained in a spreadsheet by one person, gets updated on the 19th. For 18 days, every fitting sold carries about 6 points less margin.
How to Fix It
- Set a cost-change trigger. Any supplier cost movement above 2% creates a repricing task automatically.
- Assign one owner. One person, not a committee, signs off on every list change.
- Publish on a schedule. Monthly for stable categories, weekly for volatile ones like metals, resin and fuel-linked items.
- Date every list. Put an effective date on page one so customers know which version applies.
⚠️ Warning: If your list has no effective date, customers will treat any old copy as valid. Honoring an expired price is a margin leak you created yourself.
Mistake 2: Flat Markup on Everything
Applying one markup percentage across the entire catalog feels fair and simple. It is also expensive. Fast-moving commodity items can bear a thinner markup because customers compare them constantly. Slow-moving, specialty and urgent items can carry a much richer one.
Markup by Category Behavior
| Item type | Customer price sensitivity | Typical markup approach |
|---|
| Fast-moving commodity | Very high | Lean markup, watch competitors weekly |
| Core stocked items | Medium | Standard markup, review monthly |
| Slow-moving specialty | Low | Premium markup, review quarterly |
| Emergency or rush items | Very low | Premium plus service fee |
| Private label | Medium | Higher markup, you control the story |
A flat 25% markup underprices the specialty line and overprices the commodity line. You lose margin on one and lose orders on the other.
A Simple Segmentation Exercise
Pull twelve months of sales and sort every SKU into three buckets: price-visible (customers shop it), price-neutral (customers buy it without comparing), and price-blind (customers need it now and rarely question the number). Then assign target margins to each bucket. Even a rough three-tier model beats a flat percentage.

Mistake 3: Discount Tiers Nobody Can Explain
Volume tiers are meant to reward larger orders. In reality, many distributors have tiers that grew by accident: a deal for one big account became the "Tier B" everyone eventually got.
Signs Your Tiers Are Broken
- Reps cannot recite the tier thresholds without checking
- A customer buying 10 units gets nearly the same price as one buying 100
- Tier prices drop below the next tier's landed cost
- New customers receive better terms than loyal ones
- Tiers differ by region for no documented reason
Cleaner Tier Design
| Tier | Quantity break | Discount from list | Margin floor |
|---|
| List | 1 to 9 | 0% | Full margin |
| Tier 1 | 10 to 49 | 4% | Target minus 2 points |
| Tier 2 | 50 to 199 | 8% | Target minus 4 points |
| Tier 3 | 200 and up | 12% | Hard floor, approval needed below |
The numbers above are an example, not a rule. What matters is that every tier has a margin floor that no one can breach without approval. That single guardrail stops most silent erosion.
✅ Best practice: Make tier thresholds meaningful. If the jump from one tier to the next is smaller than a typical reorder, customers will simply split orders and game the system.
Mistake 4: Too Many Versions in Circulation
Here is a scenario every distributor knows. A rep emails a PDF price list in March. The customer saves it. In June the list changes, but the customer keeps ordering from the March copy, and nobody pushes back because the order is large.

Static files create this problem. Once a PDF leaves your outbox you cannot update it, recall it, or see who opened it.
Static PDF Versus a Live Digital List
| Factor | Emailed PDF or spreadsheet | Live digital flipbook |
|---|
| Updates reach customers | Only if they re-download | Same link always shows the latest |
| Old versions in circulation | Dozens | One |
| Access control | None once sent | Password protection available |
| Visibility into who viewed it | None | Analytics on Professional plan |
| Mobile reading | Often poor | Responsive on any device |
| Looks professional | Varies | Branded, page-turn presentation |
This is where converting your list into a hosted flipbook pays off. With the PDF to Flipbook Converter you upload the current price list and share a link. When prices change, you replace the file and every customer holding that link sees the new version, so there is no March copy to honor in June.
Mistake 5: Special Deals That Never Expire
Every distributor has done it. You give a strategic customer a temporary price to win a project. The project ends, the deal stays, and three years later the account is still buying at a price that no longer makes sense.
The Anatomy of a Zombie Deal
- No end date was recorded
- The price was agreed verbally or by email
- The rep who made the deal left the company
- Cost has risen since, but the special price never moved
- Nobody reviews contract pricing on a calendar

A Three-Step Expiration Habit
- Every special price gets an end date at the moment it is created, even if you plan to renew it.
- Run a monthly expiring-deals report and send it to sales leadership.
- Renew by exception. Deals lapse unless someone justifies keeping them with current margin data.
💡 Pro tip: Keep customer-specific price sheets separate from your public list. A private, password-protected digital catalog per major account makes it obvious which prices are special and when they end.
Mistake 6: Hiding Fees and Surcharges
Freight, fuel surcharges, minimum order fees, restocking charges and credit card fees all cost real money. When they live only in the fine print, or in a rep's memory, they are waived constantly.
Fees Worth Printing on the List
| Fee type | Where leakage happens | Fix |
|---|
| Freight | Absorbed to close deals | State free-shipping threshold clearly |
| Fuel surcharge | Dropped when customers push back | Tie to published index, show on list |
| Minimum order | Waived informally | Print the minimum and the small-order fee |
| Restocking | Forgotten at returns | Put percentage on page one |
| Card processing | Eaten by distributor | Add a stated card fee or cash discount |
Printing fees on the list turns waivers into conscious choices. A rep who must approve a waiver thinks twice. A rep who never knew the fee existed never will.
Mistake 7: Unit-of-Measure Confusion
Price per each, per case, per pallet, per hundred, per thousand. When the list mixes units without clear labels, you get two kinds of loss: customers who buy the wrong quantity and demand credits, and orders priced per unit when the cost was per case.
Practical Rules for Units
- Show one primary selling unit per SKU and make it visually obvious.
- Display the conversion next to the price, for example "24 per case."
- Never mix "per 100" and "each" in the same column.
- Add a per-unit comparison column for items with multiple pack sizes.

A fastener distributor once found that a single pack-size confusion on a top-50 SKU cost roughly $9,000 over a year. The fix took ten minutes: a clearer label and a converted unit price.
Mistake 8: No Review of Realized Price
The price on the list and the price actually paid are different numbers. The gap between them, called price leakage or the "price waterfall," is where most margin disappears. Yet many distributors never measure it.
What to Track Monthly
- Average realized price versus list price, by customer segment
- Percentage of invoice lines below the margin floor
- Discount depth by rep and by region
- Number of manual price overrides per week
- Margin on the top 100 customers

You do not need expensive software to begin. An export of invoice lines into a spreadsheet, sorted by margin percentage, will show you the worst offenders in an afternoon.
⚠️ Warning: Do not punish reps the first time you share this data. Use it to find unclear rules. Most overrides come from missing guidance, not bad intent.
How to Fix Your Price List Process
You do not need to repair everything at once. Work through a sequence that returns money early.
A 30-Day Repair Plan
| Week | Focus | Outcome |
|---|
| 1 | Audit top 20% of SKUs against current cost | List of underpriced items |
| 2 | Set margin floors and tier rules | Written pricing policy |
| 3 | Review special deals and add end dates | Clean contract price register |
| 4 | Publish one controlled digital list | Single source of truth |
Publish One Controlled List
The final step is delivery. The best pricing policy fails if customers keep using old files. Here is how to publish a single controlled price list with Flipbooks AI:
- Create an account and open the upload screen.
- Upload your price list PDF. It converts into a page-turning flipbook in moments.
- Apply custom branding: your logo, brand colors and page effects, so the list looks like your company.
- Add multimedia where useful, such as product videos or spec sheets embedded on key pages.
- Set sharing options. Copy a direct link, grab an embed code, or add password protection for account-specific pricing.
- Turn on analytics (Professional plan) to see which customers opened the list and which pages they viewed.
- Replace the file when prices change. The link stays the same, so customers always see the current version.

Flipbooks AI never adds watermarks, works well on phones, and supports offline downloads for customers who need the list in a warehouse or a truck. If you want a purpose-built option, try the Digital Price List Generator. For a broader product range, the Digital Catalog Maker handles pricing alongside photos and specifications. You can also embed the flipbook on your website so your online and PDF pricing never drift apart.
Which Plan Fits Your Team
| Need | Suitable option |
|---|
| One list, a few customers | Starter-level plan, shared link |
| Several price lists by customer segment | Standard plan with unlimited flipbooks |
| Track opens and capture leads | Professional plan with analytics |
| Private account pricing | Any plan with password protection |
Review the current pricing plans to match your volume of lists and customers.
What a Healthy Price List Looks Like
A healthy list is not complicated. It is current, consistent and controlled. Check yours against this list:
- Effective date printed on the first page
- Every SKU priced from current landed cost
- Margin floors defined by category
- Tier breaks that reward real volume
- Fees and minimums visible on the page
- Units labeled and converted
- One live version, shared by link
- Monthly review of realized price against list

A Real-World Example
An electrical distributor with 4,200 SKUs applied this checklist over one quarter. They repriced the top 800 items to current cost, added margin floors, ended eleven legacy special deals, and replaced emailed PDFs with a single shared flipbook. Average realized margin rose by 1.8 points with no loss of key accounts. On roughly $15 million in revenue, that is about $270,000 a year, recovered by tidying a document.
Start Plugging the Leaks
Margin does not vanish all at once. It leaks through lists that lag behind costs, tiers nobody can defend, deals that never end and files nobody can recall. Each fix on this page is small, and together they protect real money.
Ready to put your pricing in one place? Get started for free on Flipbooks AI and publish your first live price list today. Browse all flipbook tools to find the right format for catalogs, sales presentations and more, or compare pricing plans to choose what works for your team.



