Your nonprofit changed lives this year, but a 40 page PDF sitting in a donor's inbox will not say so. The best interactive report tools for nonprofit impact stories turn raw numbers and field photos into something people actually open, read, and share. If you want a fast route, Flipbooks AI converts a PDF into a page-turning digital report in minutes, and the rest of this ranking shows where it fits against other popular options.
Below you will find a ranked list, three comparison tables, a step-by-step tutorial, and practical examples from real nonprofit scenarios. No jargon, no filler, just what works for small teams with limited budgets.
Why Static Reports Fall Short
Most annual reports follow the same pattern. A designer lays out pages, the team exports a PDF, and someone emails it with a subject line that nobody remembers. Donors skim the first page and close the file.

An interactive report changes the reading experience. Pages flip like a magazine, videos play inline, links open donation pages, and readers on phones get a layout that fits their screen.
The Problem With PDF Attachments
PDFs are heavy, hard to read on a phone, and impossible to track. You never learn whether a major donor read page 3 or abandoned it on page 1.
What Interactive Formats Add
- Embedded video and audio for beneficiary testimonials
- Clickable links to donation forms and program pages
- Mobile-friendly layouts that need no pinching or zooming
- Reader analytics showing which pages hold attention
- Password protection for sensitive board or grant material
💡 Pro tip: Donors who see a face and a number together remember both. Pair every statistic with a photo or a short quote.
Before ranking anything, it helps to agree on criteria. Nonprofits have needs that corporate marketing teams rarely share.
Cost and Pricing Clarity
Budgets are tight. A tool with hidden export fees or forced watermarks defeats the purpose. Look for transparent plans and no branding forced onto your pages.
Speed for Small Teams
Many nonprofits have one communications person wearing five hats. A tool that needs a designer and a week of training will not get used.
Storytelling Support
Impact reports are about people first. The software must handle large photos, video, quotes, and clean typography without fighting you.
Sharing and Tracking
You need embed codes for your website, direct links for email, and some form of reader insight to prove the report works.
| Criterion | Why It Matters | What to Check |
|---|
| Price | Grants and donations are limited | Free tier, nonprofit pricing, watermark policy |
| Ease of use | Staff turnover is common | Upload and publish in under an hour |
| Media support | Stories need photos and video | Inline video, audio, image galleries |
| Sharing | Reports must reach donors | Embed code, short link, password option |
| Insights | Funders ask for proof | Page views, time spent, lead capture |
Here is how the leading options compare for impact storytelling specifically. Rankings reflect fit for nonprofits that start from a designed document and want a polished, shareable result.
1. Flipbooks AI
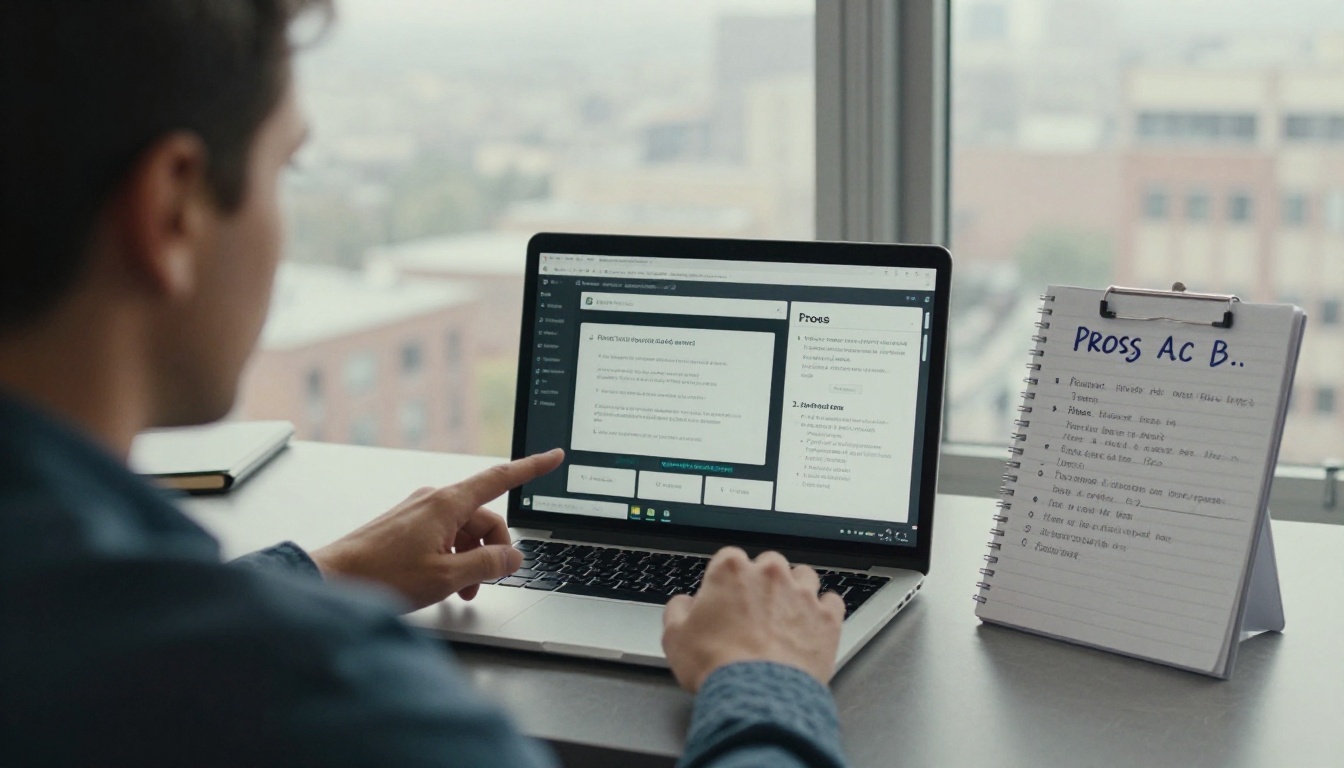
Flipbooks AI takes a finished PDF and produces a realistic page-turning publication. It works well when your designer already built the report in InDesign or Canva and you simply need a better delivery format.
- No watermarks, ever
- Embed video and audio into pages
- Password protection for private content
- Mobile-responsive reading
- Custom branding with your colors and logo
- Analytics and lead generation on the Professional plan
The dedicated Non-Profit Annual Report tool is built for exactly this use case. For general documents, try the Report Flipbook Creator.
2. Canva
Canva is a design tool with a huge template library. It is friendly for teams without designers and can export presentations and documents with links. Its strength is layout, not reader tracking, so many teams design in Canva and publish elsewhere.
3. Shorthand
Shorthand specializes in scrolling narrative stories with full-bleed photos and video. It suits a single long-form story well. Pricing tends to be higher, which matters for small organizations.
4. Flourish
Flourish excels at animated charts and data stories. If your impact is mostly numbers, such as meals served by region, it makes the data visible. It is less suited to text-heavy narrative reports.
5. Tableau Public and Looker Studio
These dashboards suit data-rich organizations with analysts on staff. They are powerful for live metrics but demand more setup, and they feel cold next to a human story.
6. Issuu
Issuu hosts publications and gives them a magazine look with built-in discovery. Free usage is often limited with platform branding, so check the current terms before committing.
| Tool | Best For | Watermark-Free | Learning Curve | Starting Point |
|---|
| Flipbooks AI | PDF to page-turning report | Yes | Very low | PDF upload |
| Canva | Designing from templates | Varies by export | Low | Template |
| Shorthand | Long scrolling stories | Paid plans | Medium | Blank story |
| Flourish | Animated data charts | Paid plans | Medium | Spreadsheet |
| Tableau / Looker Studio | Live dashboards | Yes | High | Data source |
| Issuu | Public magazine hosting | Paid plans | Low | PDF upload |
⚠️ Always check current pricing and export terms on each vendor's site. Plans change often, and a free tier can look very different six months later.
How to Create an Impact Report With Flipbooks AI
This tutorial assumes you already have a PDF. If you do not, design one in Canva, Word, or Google Docs first.
Step 1: Open Your Account
Visit Flipbooks AI and create an account. The signup takes a minute.
Step 2: Upload Your PDF
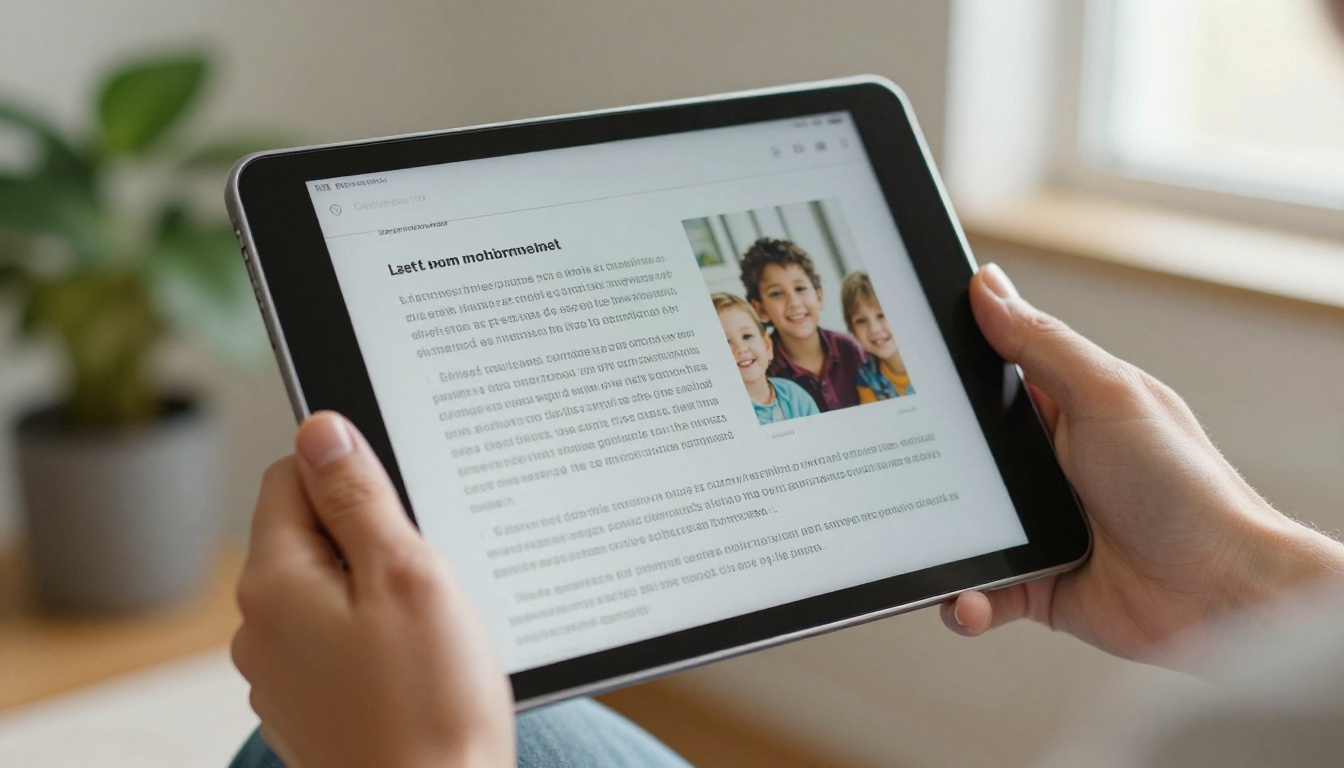
Drag your impact report into the PDF to Flipbook Converter. The conversion preserves your layout and turns each page into a flippable spread.
Step 3: Customize the Look
- Add your logo and brand colors
- Pick a background that matches your website
- Choose page-turn effects and sound settings
- Add links to your donation page on the final spread
Step 4: Add Multimedia
Place a short video testimonial beside a beneficiary story. Audio clips work well for oral histories and interviews. Keep each clip under two minutes.
Step 5: Share It
- Direct link for email newsletters
- Embed code for your website via the Embed Flipbook on Website tool
- Password protection for board packets and grant reviewers
Step 6: Track and Follow Up
On the Professional plan you get analytics and lead generation, so you can see which donors opened the report and when. View pricing plans to compare tiers. Offline downloads are also available when funders prefer a file.
✅ Best practice: Send the report with a short personal note to your top 20 donors. Follow up a week later using what the analytics tell you about their reading.
Real Examples of Impact Stories That Work
Tools only matter when the content is strong. These scenarios show how different nonprofits use interactive reports.

A Food Bank Shows Meals Served
A regional food bank opens its report with a single photo of a volunteer packing boxes, then a number: meals provided this year. Each page after it pairs a neighborhood with a short quote from a family. A video from the warehouse floor plays inline on page six.
An Environmental Group Maps Its Work
A reforestation charity uses Flourish for an animated planting map, then embeds the chart image and a link in its flipbook. Readers get the data and the story in one document.
A Youth Education Program Proves Outcomes
An after-school program places attendance rates beside student portraits and teacher quotes. The report ends with a clear donation button.

A Clinic Uses Photography
A community clinic hires a volunteer photographer for portraits of patients who consented to share their stories. The report becomes a portfolio of faces, which you can also build with the Photography Portfolio tool.

There is no single winner for every organization. Match the tool to your team and your content.
| Your Situation | Best Pick | Reason |
|---|
| You have a finished PDF | Flipbooks AI | Fast conversion, no watermark |
| No designer on staff | Canva plus a flipbook publisher | Templates, then polished delivery |
| One big narrative story | Shorthand | Scrolling photo storytelling |
| Heavy on charts | Flourish | Animated data visuals |
| Live program dashboards | Looker Studio | Connects to spreadsheets and databases |
| Public magazine presence | Issuu | Built-in hosting and discovery |
Small Teams on Tiny Budgets
Combine a free design tool for layout with a flipbook publisher for delivery. You avoid paying for features you will not use.
Larger Organizations With Analysts
Pair a dashboard for internal metrics with a designed flipbook for donors. The dashboard answers staff questions, while the report tells the story.

Mistakes That Weaken Impact Reports
Even the best software cannot rescue a report with these problems.
- Too many statistics, too few people. Numbers without faces feel abstract.
- No clear next step. Every report needs a donate, volunteer, or share button.
- Stock photos. Real images from your programs build trust. Always get consent.
- Ignoring mobile readers. Most donors open email on a phone.
- Hiding the results on page 30. Lead with your strongest outcome.
- No tracking. Without data you cannot improve the next edition.
⚠️ Protect privacy. Remove names, addresses, and identifiable details of beneficiaries unless they have given written permission.
A Simple Structure That Works
| Section | Purpose | Suggested Length |
|---|
| Opening story | Hook with one person | 1 page |
| Headline numbers | Show scale | 1 page |
| Program highlights | Show variety | 4 to 6 pages |
| Donor thank you | Build loyalty | 1 page |
| Financial summary | Prove stewardship | 2 pages |
| Call to action | Drive next step | 1 page |
Sharing Reports Where Donors Are
A finished report only helps if people see it. Plan distribution before you hit publish.

Email and Social
Send the direct link with a short subject line that names a result, such as the number of families helped. Post a single striking page as an image on social platforms with the link in the caption.
Events and Meetings
Display the report on a tablet at your gala or open house. A QR code on each table sends guests straight to the publication.

Donor Meetings
Use the report as a conversation tool. Walk a major donor through two or three pages instead of reading numbers aloud.

Your Website
Embed the flipbook on a dedicated impact page so visitors read it without downloading anything. Browse all flipbook tools for more formats such as newsletters and event programs.
Start Your Next Impact Report
The right tool saves hours and gives donors a reason to keep reading. For most nonprofits with a finished PDF, a flipbook publisher is the quickest path to a professional result. Designers who want a template can start in Canva, and data-heavy teams can add Flourish charts.
Ready to publish? Get started for free on Flipbooks AI, try the Non-Profit Annual Report tool, or compare pricing plans to pick what fits your budget. When you are set to commit, the account and pricing page gets you there in one click.



