Your program ran 48 workshops, served 612 people and handed out 3,000 meals. Great. Now the funder reading your report asks the only question that matters: so what changed? If your report cannot answer that in the first page, it joins the pile of documents that get a polite "thank you" and nothing more. These grant report tips will help you replace activity counts with outcomes, and package the story in a format people actually finish. If you want a head start on the packaging side, Flipbooks AI turns a PDF into an interactive report in minutes.
Why Activity Counts Fall Short
Activity counts describe what you did. Outcomes describe what changed for the people you serve. Funders invest in change, so a report built around effort leaves them to guess whether the money worked.

Counts are not useless. They prove the work happened and show scale. The problem begins when they are the only evidence. A program officer who reads "we held 48 workshops" learns nothing about whether anyone got a job, felt safer, or ate better.
The Output Versus Outcome Gap
An output is a direct product of your work: sessions, meals, flyers, visits. An outcome is the shift that follows: skills gained, behavior changed, conditions improved. Think of outputs as the receipts and outcomes as the result.
What Program Officers Actually Want
Most program officers manage a portfolio and must justify each grant to a board. They need a sentence they can repeat. "Participants who finished the course were twice as likely to hold a job after six months" is repeatable. "We ran 48 workshops" is not.
💡 Pro tip: Read your last report and highlight every number. If most of the highlighted numbers describe your own effort, you have an activity report, not an outcomes report.
Outputs and Outcomes Side by Side
The easiest way to fix a report is to translate each activity into the change it was meant to cause. This table shows the shift for common nonprofit programs.
| Program Type | Activity Count (weak) | Outcome Statement (strong) |
|---|
| Job training | 48 workshops held | 71% of graduates employed within 90 days |
| Food pantry | 3,000 meals distributed | 64% of households report fewer skipped meals |
| Youth tutoring | 1,200 tutoring hours | Average reading level rose 1.4 grades |
| Health outreach | 15 screening events | 38 early diagnoses referred to treatment |
| Community garden | 40 volunteers recruited | 22 families now grow food at home |
Notice that each strong statement still contains a number. Outcomes are not vague feelings. They are measurable, just aimed at a different target.
Use Both, in the Right Order
Lead with the outcome and support it with the output. For example: "Seventy-one percent of graduates found work, supported by 48 workshops and 1,100 coaching hours." The activity becomes the proof of effort behind the result, which is exactly where it belongs.
Start With a Simple Logic Model
You cannot report outcomes you never defined. Before you write a single paragraph, sketch how your work is supposed to lead to change.
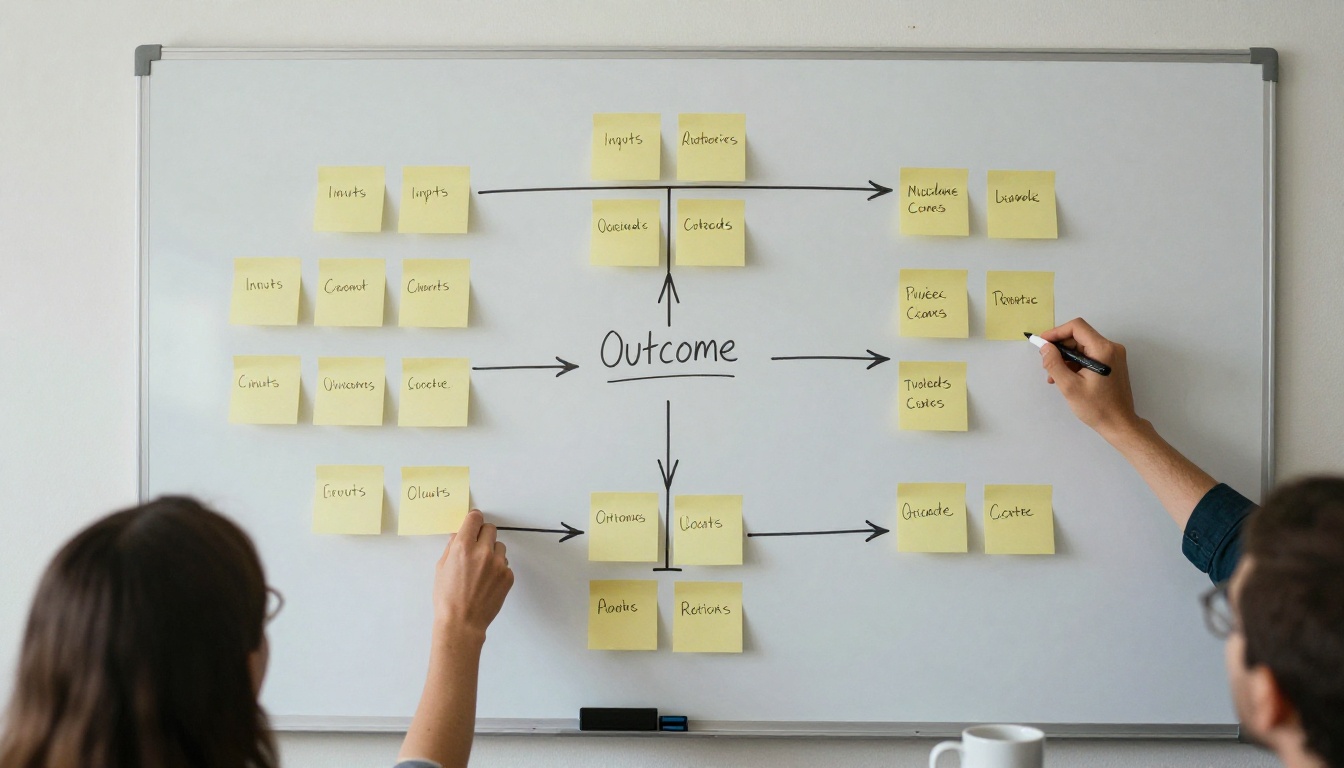
A logic model has five boxes: inputs, activities, outputs, short-term outcomes and long-term outcomes. Put them on a whiteboard or sticky notes and draw arrows between them. If an arrow feels shaky, you have found a gap your funder will also notice.
Short-Term Versus Long-Term Results
Short-term outcomes show up during or right after the program: new knowledge, confidence, a certificate. Long-term outcomes take months or years: stable housing, a promotion, better grades. Be honest about which ones you can measure inside the grant period. Funders respect a clear line between "we measured this" and "we expect this to follow."
A Quick Planning Checklist
- Write one sentence describing the change you want for participants.
- List two or three indicators that would prove that change.
- Decide how and when you will collect each indicator.
- Assign one person to own the data.
- Note what you will do if the numbers come in lower than hoped.
How to Collect Outcome Evidence
Good outcome reporting depends on good data habits long before the deadline. Collecting evidence in the final week is how teams end up with a report full of guesses.

Pick Indicators You Can Actually Track
Choose a small number of indicators, ideally three to five. A short list collected consistently beats a long list collected sporadically. Prefer indicators that already fit your workflow, such as a sign-in sheet that also records a starting skill level.
Before and After Beats a Single Snapshot
A single number tells funders where people are. Two numbers tell them how far people moved. A short survey at intake and again at exit, using the same questions, gives you a clean before and after comparison without any special software.
Mix Numbers With Voices
Numbers prove scale and quotes prove meaning. A funder may forget "64% reported fewer skipped meals," but remember a mother saying her kids stopped hiding food in their backpacks. Use both, and keep quotes short and specific.
| Evidence Type | Best For | Effort | Watch Out For |
|---|
| Intake and exit surveys | Skill or attitude change | Low | Low response rates |
| Administrative records | Jobs, grades, referrals | Medium | Data sharing permissions |
| Interviews | Depth and context | Medium | Small sample sizes |
| Photos and short video | Human proof | Low | Consent and privacy |
| Follow-up calls | Long-term results | High | Participants who move away |
⚠️ Warning: Always get written consent before sharing names, photos or stories. Anonymize quotes when the topic is sensitive, and tell funders that you did.
Tell the Story With Participants
Evidence persuades, but stories make a report memorable. The most effective grant reports pick one or two participants and follow them from the starting point to the result, with the numbers sitting alongside.

A Simple Story Structure
- Where they started: one or two concrete details.
- What the program did: the specific support they received.
- What changed: a measurable result in their words.
- Why it matters: how their case reflects the wider group.
Real-World Example
A neighborhood literacy group used to report "900 volunteer hours." After switching to outcomes, their report opened with a fourth-grader who went from skipping reading aloud to leading a class presentation, followed by the statement that 58% of enrolled children improved a full reading level. The renewal conversation shifted from "how many hours?" to "how do we reach more kids?"
Build a Report Funders Will Finish
Even strong evidence loses power when it hides on page 14. Structure matters as much as content, so design the report for a reader who is busy and skimming.
A Reliable Section Order
- One-page summary: the three biggest results, in plain language.
- Goals and what changed: each goal paired with its outcome data.
- Participant story: one short, specific narrative.
- What did not work: honest setbacks and what you adjusted.
- Financial summary: how funds were spent, tied to results.
- Next steps: what you will do with the lessons.

Be Honest About Missed Targets
Missing a target is not fatal. Hiding it is. Program officers read many reports and quickly spot spin. A short paragraph explaining why a number fell short, and what you changed, builds more trust than a perfect-looking page.
✅ Best practice: Put the single most important outcome in the first two sentences of your report. A busy reader should be able to stop there and still know what you achieved.
Keep the Language Plain
Skip jargon like "capacity building" or "stakeholder synergies" unless the funder uses those words in their guidelines. Say what happened. Use short sentences, active verbs and numbers with units.
A dense PDF attached to an email is the default, and it is also the easiest thing to ignore. An interactive report with photos, page-turning and embedded charts gets attention, and it lets you show outcomes visually instead of describing them.

| Format | Visual Impact | Easy to Share | Tracks Readers | Mobile Friendly |
|---|
| Email attachment PDF | Low | Medium | No | Poor |
| Slide deck | Medium | Medium | Limited | Medium |
| Printed binder | High | Low | No | No |
| Interactive flipbook | High | High | Yes (Professional plan) | Yes |
Why a Flipbook Works for Grant Reports
A flipbook keeps your report design intact on any screen, loads from a single link, and can include embedded videos of participants, audio testimonials and clickable tables of contents. You can also protect it with a password when it contains sensitive data, and funders do not need to download anything.
How to Create a Grant Report Flipbook
Here is a practical walkthrough using Flipbooks AI, built around the outcomes structure above.
Step 1: Sign Up and Prepare Your PDF
Create an account, then finish your report in whatever tool you prefer (Word, Google Docs, Canva) and export it as a PDF. Put your outcomes summary on page one and use clear headings so the table of contents works well.
Step 2: Upload and Convert
Drop the PDF into the PDF to Flipbook Converter. Conversion takes a short moment, and your pages become a realistic page-turning book with no watermarks.
Step 3: Customize the Look
Add your logo, pick colors that match your branding and choose a page effect. Then embed short videos or audio clips from participants, since a thirty-second testimonial often persuades more than a paragraph. For a more formal layout, try the Non-Profit Annual Report tool or the Report Flipbook Creator.
Step 4: Share and Protect
Share a direct link, or use the embed option to place the report on your website. If the report contains participant data, turn on password protection and send the password separately. You can also enable offline downloads for funders who prefer a file.
Step 5: Track Who Reads It
With the Professional plan, analytics show whether the program officer opened the report and which pages held their attention. That is useful feedback for your next submission. Compare options on the pricing page.

💡 Pro tip: Add a short "Results at a glance" page near the front with three large numbers and a photo. It gives a skimming reader everything and tempts them to keep turning pages.
Common Mistakes to Avoid
Even teams that care about outcomes fall into predictable traps. Watch for these before you submit.
Mistake 1: Claiming Credit for Everything
If unemployment fell in your city, you cannot claim every job placement as your program's effect. Say what you measured and be careful with the word "caused." Phrases like "participants reported" and "associated with" are both honest and acceptable.
Mistake 2: Burying the Result
Do not open with a history of your organization. Funders know who you are. Start with what changed.
Mistake 3: Using Averages That Hide People
An average improvement can hide a group that did not improve at all. Where possible, report the share of participants who hit a target, and mention who the program did not reach yet.
Mistake 4: Skipping the Budget Link
Tie dollars to results. "$42,000 supported 38 graduates, about $1,100 per participant who found work" gives the funder a cost per outcome that fits straight into their own reporting.
Mistake 5: Sending the Report Without a Next Step
End with a specific ask or update: renewed funding, an introduction, a site visit. A report with no next step ends the conversation instead of continuing it.
Quick Reference Checklist
Use this list right before you send your next report.
- The first page states the top three outcomes in plain language.
- Every activity count is paired with a result it supports.
- At least one before and after comparison appears.
- One participant story, with consent, sits near the front.
- Missed targets are explained, not hidden.
- Dollars are tied to results.
- The format is visual, mobile friendly and easy to open.
- A next step is clearly stated.
| Report Section | Weak Version | Strong Version |
|---|
| Opening | History of the organization | Top three outcomes with numbers |
| Data | Totals of events and attendees | Before and after change with percentages |
| Story | Generic praise | Specific participant journey |
| Setbacks | Not mentioned | Explained with an adjustment |
| Close | "Thank you for your support" | Clear results and a proposed next step |
Turn Your Next Report Into a Renewal
Funders are not looking for longer reports. They are looking for evidence that their money changed something, delivered in a form that respects their time. Define outcomes early, collect before-and-after evidence, tell one honest story and lead every page with the result.
Ready to build yours? Get started for free on Flipbooks AI, browse all flipbook tools to find a template that fits, or compare pricing plans to add analytics and lead tracking. Your outcomes deserve a report people want to open.