You mailed 10,000 catalogs last month. Orders went up. But which catalog, which page and which audience actually made the cash register ring? Without a tracking system, print stays a leap of faith. With two cheap tools, a QR code and a promo code, it becomes a channel you can measure to the dollar. If you also publish a digital edition through Flipbooks AI, you can connect both worlds in one reporting view.
This article walks through exactly how to track print catalog sales with QR and promo codes, from naming conventions to ROI math, with tables and templates you can copy today.
Why Print Attribution Is Hard
Online ads come with built in dashboards. A printed catalog does not. A customer flips through pages on the couch, forgets about it for two weeks, then types your web address from memory. Your analytics records that visit as "direct" traffic, and the catalog gets zero credit.
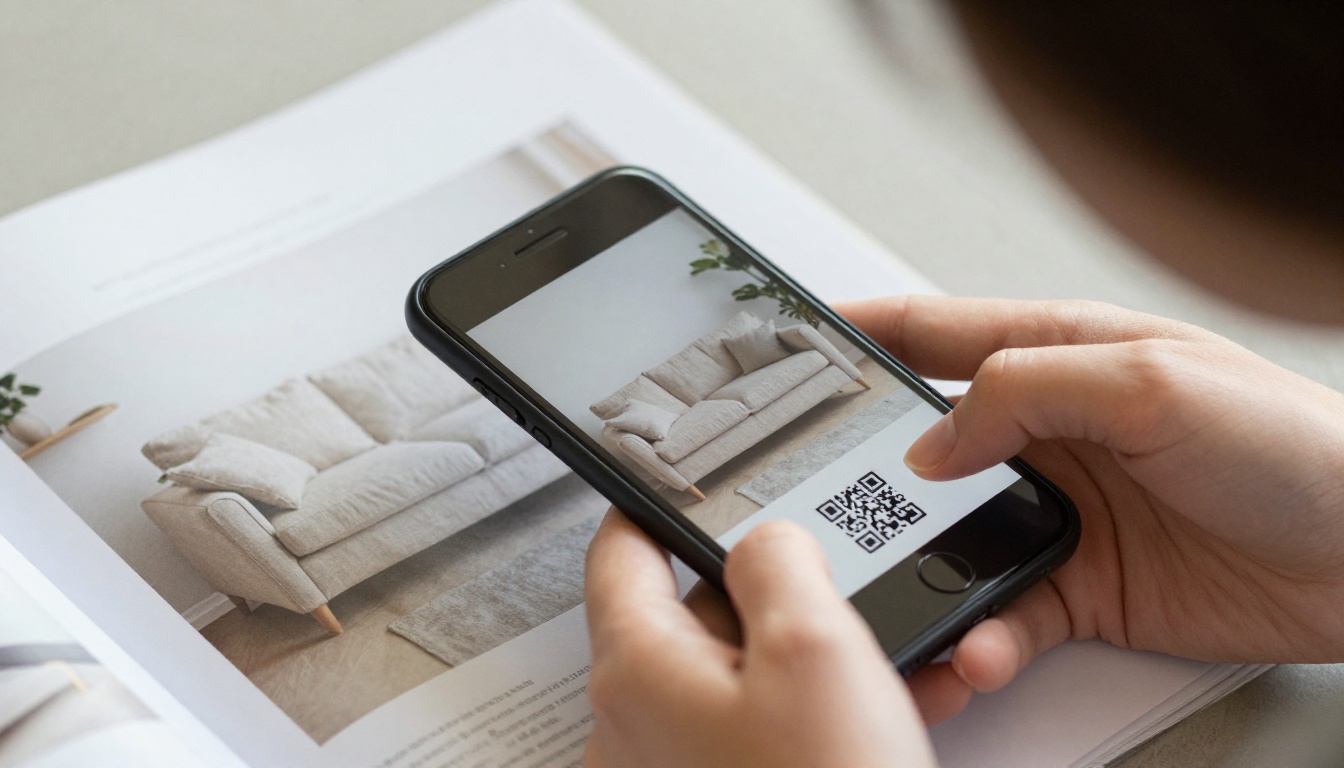
Three problems cause most of the blind spots:
- Delayed response: Catalogs sit on coffee tables for weeks, so the sale lands long after the mailing.
- Channel switching: A shopper sees the catalog, then searches your brand on a phone.
- Offline purchases: Phone orders and in store buys never touch your website analytics.
QR codes catch the people who act immediately. Promo codes catch the people who act later, or in another channel. Used together, they close most of the gap.
💡 Pro tip: Treat QR codes as your click tracking and promo codes as your memory tracking. Each one covers the weakness of the other.
Neither method is perfect alone. Here is how they compare in practice.
| Factor | QR Code | Promo Code |
|---|
| Customer effort | One scan | Type a code at checkout |
| Works for phone and store orders | No | Yes, if staff ask for it |
| Captures delayed purchases | Partly, via cookies | Yes |
| Tracks browsing behavior | Yes, with UTM tags | No |
| Cost to set up | Free to low | Free |
| Risk of leakage | Low | High, codes get shared on coupon sites |
| Best for | Page level and mailing level data | Order level proof of revenue |
The practical takeaway: use QR codes to see what people looked at, and promo codes to prove what they bought.
Build a Tracking Plan First
Before printing anything, decide what you want to measure. Most brands end up wanting four levels of detail.
- Catalog level: Spring edition versus fall edition.
- Mailing level: Which list or segment received it.
- Page level: Which product page triggered the scan.
- Customer level: Which individual redeemed the offer.
Pick a Naming Convention
A messy naming system is the number one reason tracking falls apart. Use a pattern that a new teammate can decode in five seconds.
| Element | Example | Meaning |
|---|
| Season | SPR26 | Spring 2026 edition |
| Segment | VIP | Top customer list |
| Version | A | Test version A |
| Full promo code | SPR26VIPA | Combined code |
| UTM campaign | spr26_vip_a | Used in the QR link |
Keep codes short, uppercase and free of lookalike characters such as 0 and O.
Set One Primary Goal
Choose a single success metric for each mailing: revenue, new customers, or reactivated customers. Tracking everything equally produces reports nobody reads.
Create Unique QR Codes
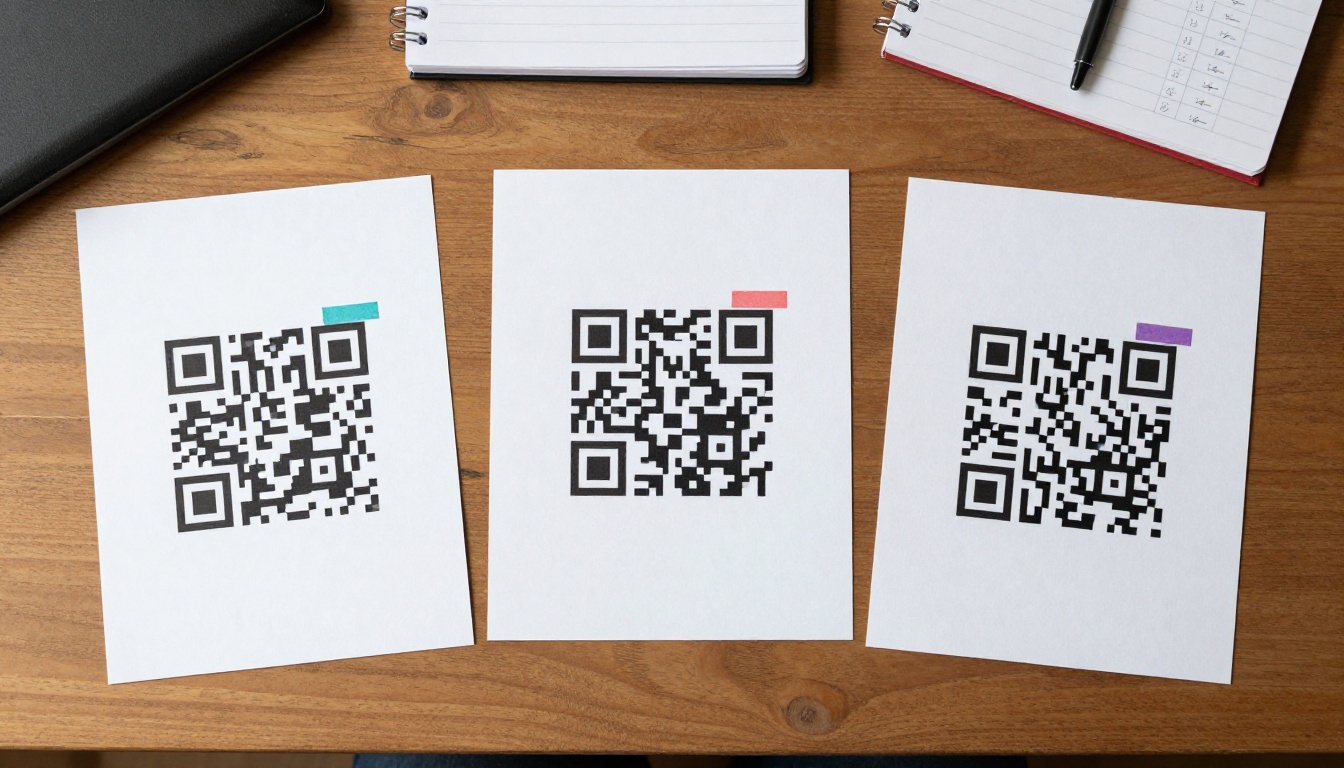
A QR code is only as useful as the link behind it. Never point every code at your homepage.
Use Dynamic QR Codes
Dynamic QR codes redirect through a short link you control. That gives you two benefits: you can change the destination after printing, and you get scan counts, device types and rough locations. Static codes cannot do either.
Add UTM Parameters
Append campaign tags to the destination URL so your web analytics tool labels the visit correctly:
utm_source=catalogutm_medium=printutm_campaign=spr26_vip_autm_content=page12_sofa (for page level tracking)
Link to a Matching Landing Page
If a QR code sits next to a sofa, send the scan to the sofa product page, not a generic catalog index. Fewer clicks means more orders. A good landing page also pre fills the promo code, which removes the typing step completely.
✅ Best practice: Print the QR code at least 2 cm wide, leave a clear white border, and add a short line such as "Scan to shop this look" so people know why to scan.

A promo code should be easy to say aloud, easy to type on a phone, and impossible to confuse with another code.
One Code per Audience
Give each mailing segment its own code. If VIP customers get SPR26VIP and lapsed customers get SPR26BACK, your sales report instantly shows which segment responded better.
One Code per Test Version
If you are testing two cover designs or two offers, print a different code on each. That turns every mailing into a clean A/B test.
Limit Leakage
Codes printed on a catalog tend to end up on coupon websites. Reduce the damage with these controls:
- Set an expiration date and print it clearly.
- Cap total redemptions.
- Make the code valid once per customer email.
- Use personalized codes for your best customers if your printer supports variable data.
| Code Type | Leakage Risk | Tracking Precision | Printing Effort |
|---|
| One shared code for all | High | Low | Easy |
| One code per segment | Medium | Medium | Easy |
| One code per version | Medium | Medium | Easy |
| Unique code per recipient | Very low | Very high | Needs variable data printing |
Put Tracking Into Practice
Here is a worked example. A home goods brand mails 6,000 catalogs: 2,000 to VIP buyers, 2,000 to past customers who have not ordered in a year, and 2,000 to a rented prospect list.
| Segment | Catalogs Mailed | QR Scans | Orders with Code | Revenue |
|---|
| VIP | 2,000 | 310 | 168 | $21,840 |
| Lapsed | 2,000 | 140 | 62 | $7,130 |
| Prospects | 2,000 | 55 | 21 | $2,310 |
| Total | 6,000 | 505 | 251 | $31,280 |
Even with this simple table the story is clear. The prospect list produced about a tenth of the VIP revenue for the same print cost. Next season, shift that budget toward lapsed and VIP audiences.
Track Page Level Performance
If you add a unique QR code beside each featured product, you can rank pages by scans. Pages with many scans but few orders signal a pricing or product page problem. Pages with few scans but strong conversion deserve a bigger layout slot next time.
Capture Phone and Store Orders

QR codes miss everyone who calls or walks in. Promo codes fix that, but only if someone asks.
Train Your Team
Give call center and store staff a short script: "Do you have a code from our catalog?" Add a required field for it in your order system so it cannot be skipped.
Add a Parcel Insert
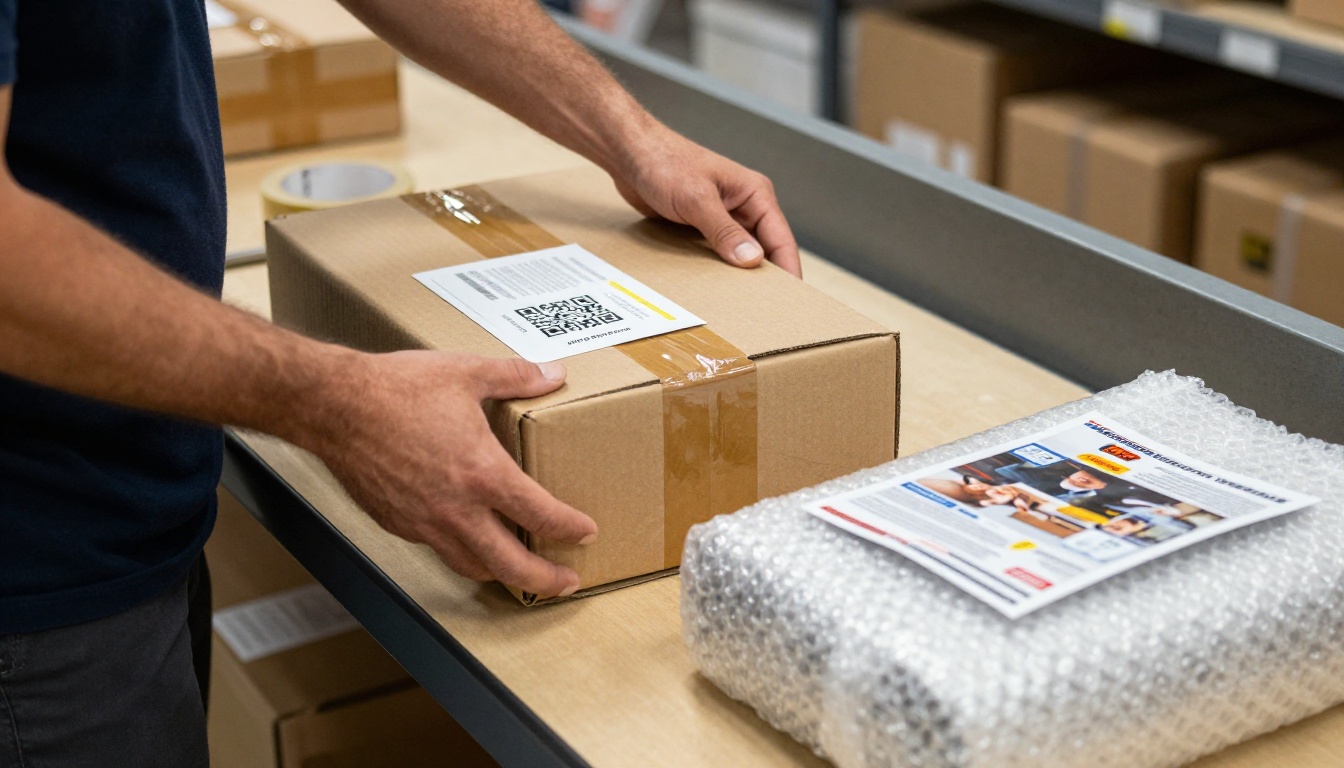
For online orders, a small insert in the box that carries a fresh QR code and a reorder code serves two purposes. It drives repeat purchases, and it lets you tie the second order back to the original catalog.
Ask a Simple Question at Checkout
A "How did you hear about us?" dropdown with "Printed catalog" as an option is cheap and surprisingly useful. It will not replace codes, but it flags the customers who ignored both.
⚠️ Warning: Do not make the promo code field mandatory. Forcing it creates abandoned carts. Keep it optional and visible.
Connect Print and Digital Catalogs
Print and digital versions work best as a pair. A flipbook edition lets customers browse on any device, and it generates its own behavior data: pages viewed, time spent and links clicked.
With Flipbooks AI you can convert the same PDF you send to the printer into a mobile friendly page flipping catalog. The PDF to Flipbook Converter takes minutes, and the Digital Catalog Maker adds clickable product hotspots.
How to Create a Trackable Digital Edition
- Export your final catalog PDF, including the printed QR codes.
- Upload it to Flipbooks AI and let it convert the pages.
- Add your brand colors and logo so the digital edition matches the printed one.
- Link each product image to its product page with the same UTM tags used in print.
- Share the flipbook by direct link, or embed it on your website.
- Review page views and click data in analytics, available on the Professional plan. See pricing plans for details.
Use a password if the catalog is meant only for wholesale buyers, and enable lead capture when you want names and emails before the flipbook opens. Offline downloads are helpful for sales reps who visit clients without a reliable connection.
| Feature | Printed Catalog | Flipbooks AI Edition |
|---|
| Cost per additional reader | Printing and postage | Practically zero |
| Page level behavior data | Only through QR scans | Built in analytics |
| Update after distribution | Impossible | Replace the file anytime |
| Lead capture | Reply cards | Forms before viewing |
| Watermarks | Not applicable | None |
Teams that sell furniture, fashion or hardware will find a matching template through the Product Catalog Generator, the Fashion Catalog Creator or the Furniture Catalog Maker.
Measure ROI Per Catalog
Revenue alone can mislead. What matters is how much profit each printed piece returned compared to what it cost.
The Core Formulas
- Cost per catalog: (Design + printing + postage + list rental) divided by catalogs mailed.
- Response rate: Orders divided by catalogs mailed.
- Average order value: Revenue divided by orders.
- Revenue per catalog: Revenue divided by catalogs mailed.
- Return on ad spend: Revenue divided by total mailing cost.
Example Calculation
| Metric | Value |
|---|
| Catalogs mailed | 6,000 |
| Total cost (design, print, postage) | $9,600 |
| Cost per catalog | $1.60 |
| Orders tracked | 251 |
| Response rate | 4.2% |
| Revenue | $31,280 |
| Average order value | $124.62 |
| Revenue per catalog | $5.21 |
| Return on ad spend | 3.26x |

Account for the Untracked Share
Not every buyer will use your code or scan your QR. Compare your tracked orders against the sales lift in the same period versus a baseline from earlier weeks. If tracked orders explain only 60 percent of the lift, scale your ROI estimate accordingly. Many brands apply a multiplier between 1.3 and 1.8 to account for untracked influence, and refine it over several mailings.
💡 Pro tip: Keep a holdout group. Skip 5 percent of an audience segment and compare their purchases with the mailed group. The difference is your true incremental lift.
A Weekly Tracking Routine
Data only helps if someone looks at it. A short weekly routine keeps the catalog campaign from drifting.
- Monday: Export last week's orders that used a catalog code.
- Tuesday: Check QR scans and landing page conversion by campaign.
- Wednesday: Compare against the holdout group and baseline sales.
- Thursday: Note which pages and products lead, and which lag.
- Friday: Update the master tracking sheet and flag codes with suspicious spikes.
Suggested columns for the master sheet:
- Catalog edition and mail date
- Segment and list source
- Promo code and QR campaign tag
- Scans, visits, orders, revenue
- Print and postage cost
- Response rate and ROI
- Notes on offers, weather, holidays or competing promotions
Common Mistakes to Avoid

Reusing One Code Forever
When the same code lives for years, you cannot separate this season's results from old ones. Retire codes at the end of each campaign.
Tiny or Low Contrast QR Codes
A code printed on a dark photo or a glossy fold will fail to scan. Test every code on at least three phones, in normal room lighting, before the print run.
Forgetting Mobile Experience
Most scans come from phones. If your landing page loads slowly or asks for a login, you lose the sale. Check load times on a mobile connection.
Ignoring Expiry Dates
Expired codes that still work make your reports meaningless. Turn them off on the date you printed.
Skipping the Test Scan
A typo in a short link can send hundreds of customers to an error page. Scan the proof copy before it goes to press.
| Mistake | Impact | Fix |
|---|
| Same code on every mailing | Blended, useless data | One code per campaign |
| Static QR with no UTM | No analytics link | Dynamic QR with tags |
| Mandatory promo field | Abandoned carts | Optional, pre filled via QR |
| No holdout group | Inflated ROI | Keep 5 percent unmailed |
| Untested QR on glossy stock | Scans fail | Proof and test before print |
Next Steps for Your Catalog
Tracking does not need expensive software. Start with one change on your next mailing: assign a distinct promo code and a dynamic QR code to each audience segment, log the results in a single sheet, and compare ROI after four weeks.
Ready to pair print with a trackable digital edition? Get started for free on Flipbooks AI, browse all flipbook tools to find a template for your industry, or compare pricing plans to pick the analytics level you need. When you are ready to upgrade, start from your account and go straight to the plan that fits.