Every nonprofit eventually faces the same question from a board member or a major donor: do we need an impact report, an annual report, or both? The honest answer is that they do two different jobs. One proves you are a responsible steward of money. The other proves that money changed something in the world. In this article, you will see how the impact report vs annual report: what donors expect from each debate plays out in practice, and how a tool like Flipbooks AI lets you publish both without a design agency.
Two Reports, Two Questions
Donors rarely read a report out of curiosity. They open it with a question in mind, and each document answers a different one.
- The annual report answers: Is this organization well run, financially sound and accountable?
- The impact report answers: What happened because I gave, and was it worth it?
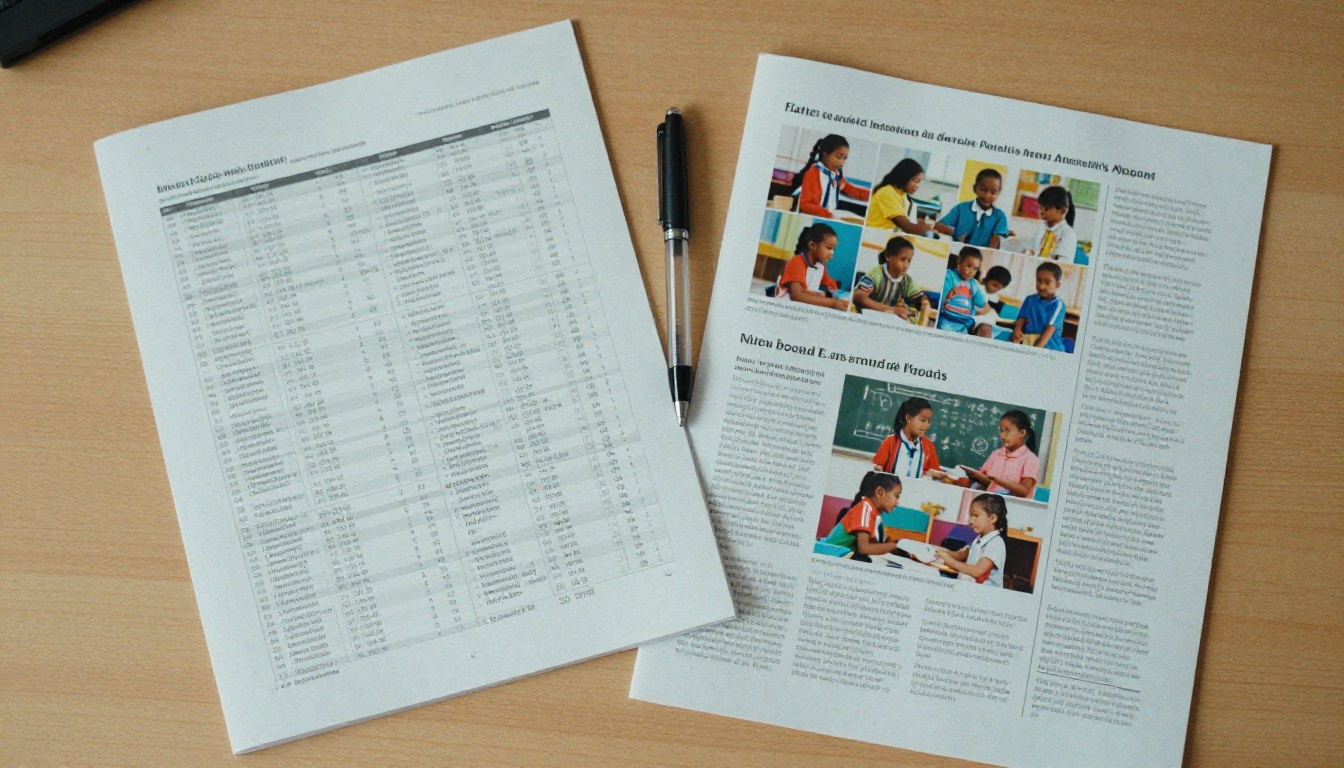
An annual report looks backward across the whole organization for a fiscal year. An impact report zooms in on outcomes, usually for a program, a campaign or a specific group of beneficiaries.
The Short Definition of Each
An annual report is a yearly summary of activities, governance and finances. Many are partly required by regulators, boards or institutional funders. It tends to include a leadership letter, financial statements, a list of board members and a donor recognition page.
An impact report is a story told with evidence. It leads with results: people housed, meals served, hectares restored, test scores raised. Numbers appear, but they sit beside photos, quotes and short case studies.
💡 Pro tip: If a reader can finish your document without learning a single outcome, you have written an annual report. If they finish it without knowing where the money went, you have written a brochure.
Side-by-Side Comparison
The table below shows where the two formats diverge most.
| Feature | Annual Report | Impact Report |
|---|
| Main question | Is the organization accountable? | Did the gift change lives? |
| Primary audience | Board, regulators, institutional funders, auditors | Individual donors, major gift prospects, community |
| Scope | Whole organization | Program, campaign or cause |
| Typical length | 20 to 60 pages | 8 to 24 pages |
| Tone | Formal, factual | Personal, narrative |
| Financial detail | Full statements, ratios, audit notes | Simple breakdown of how funds were used |
| Visual style | Charts, tables, portraits of leadership | Beneficiary photos, infographics, quotes |
| Publishing rhythm | Once per fiscal year | Yearly, per campaign, or per grant cycle |
Notice that neither format is "better." They are tuned for different readers, and mixing them usually weakens both.
What Donors Expect From an Annual Report
Supporters who open an annual report are checking for trust signals. They are scanning, not reading line by line.

Financial Transparency
The first page most readers flip to is the financials. They expect to find:
- Total revenue and where it came from
- Expenses split into programs, fundraising and administration
- Net assets and reserves
- A statement that figures were audited or independently reviewed
Hiding overhead is a mistake. Donors are far more forgiving of a 20 percent administrative share that is explained than of a 12 percent share that cannot be verified.
Governance and Leadership
Names matter. Readers look for board members, their affiliations and any conflicts of interest policy. A short letter from the executive director and the board chair signals that leadership stands behind the numbers.
Recognition and Compliance
Donor lists are a staple of the annual report. People like to see their names, and they notice when they are missing. Include giving levels, in-kind gifts and foundation partners. Add your tax-exempt status and registration details so the document works as a reference.
✅ Best practice: Keep an annual report predictable. Same section order, same financial tables, same location on your website every year. Predictability reads as stability.
What Donors Expect From an Impact Report
An impact report is read with emotion first and skepticism second. People want to feel something, then check that the feeling is justified.

Outcomes Over Activities
"We held 40 workshops" is an activity. "Of 600 participants, 410 found jobs within six months" is an outcome. Donors increasingly expect the second. Use this simple ladder:
- Inputs: money, staff, volunteer hours
- Activities: what you did with them
- Outputs: how many people or items were reached
- Outcomes: what changed for those people
- Long-term impact: what changed for the community
Most weak impact reports stop at outputs.
Real Stories With Real Faces
A single well-told story often does more than a page of statistics. Ask beneficiaries for consent, use real photographs and quote them directly. Pair every story with the data that shows it is typical rather than exceptional.
A Clear Line From Gift to Result
The best question a donor can ask is "what did my $100 do?" Answer it plainly:
| Gift Amount | What It Provided | Measured Result |
|---|
| $25 | A week of school meals for one child | 96% attendance in the program group |
| $100 | A job readiness workshop seat | 68% of graduates employed in six months |
| $500 | A family emergency housing night kit | 41 families stabilized this year |
| $2,500 | A full cohort mentoring cycle | 22 mentees completed with a plan |
The figures above are examples. Use your own verified numbers and always state the time frame.
Honesty About What Did Not Work
Surprisingly, readers trust an organization more when it admits a missed target and explains what it changed. A short "what we are adjusting" box shows learning in action and builds credibility with institutional funders too.
⚠️ Warning: Never claim causation you cannot support. Say "participants reported" or "program graduates achieved" when you have no control group.
Who Reads Which One
Different supporters gravitate to different documents. Plan for the reader, not the format.

| Reader | Opens First | Looks For | Likely Action |
|---|
| Small recurring donor | Impact report | Photos, a short story, proof of use | Keeps giving, shares on social |
| Major gift prospect | Both | Outcomes plus financial health | Schedules a meeting |
| Foundation program officer | Annual report | Audit, governance, sustainability | Renews or declines a grant |
| Corporate partner | Impact report | Measurable community results | Sponsors a campaign |
| Board candidate or auditor | Annual report | Controls, reserves, risk | Approves, questions, or joins |
Matching Format to Giving Level
A rule of thumb used by many development teams: the larger the gift, the more both documents matter. Someone giving $50 a month wants the impact story. Someone considering a six-figure gift will read the annual report cover to cover and then ask for the impact data.
Should You Publish Both?
For most organizations with more than a handful of donors, yes. They support each other. The annual report establishes that you are safe to fund. The impact report gives people a reason to want to.

A Simple Publishing Calendar
- Month 1 after fiscal year end: Close the books and collect program data
- Month 2: Draft the impact report while the audit finishes
- Month 3: Release the impact report to individual donors
- Month 4 to 5: Publish the audited annual report
- Ongoing: Send short impact updates every quarter
Releasing the impact report first is a common and effective choice. It lands while the year is still fresh in memory, and it gives donors a warm reason to open the more formal annual report later.
When One Document Is Enough
Small organizations sometimes combine the two into a single "annual impact report." If you do, keep the first half story-driven and move financial statements to a clearly labeled section at the end. Do not bury results behind 15 pages of tables.
The Corporate Angle
Corporate and foundation partners often ask for a third flavor: an impact report that maps outcomes to their giving goals.

Businesses that fund nonprofits want evidence they can quote in their own sustainability and annual reports. Give them:
- One-page summaries of measurable outcomes
- Photos they have permission to reuse
- A short statement of methodology
- A contact person for follow-up questions
A company with its own reporting duties can also use the Corporate Report Maker to present sponsorship results in the same interactive style.
Why Flipbooks Beat Static PDFs
Both reports usually start as PDFs, and that is where many of them die. Large files are slow to open on a phone, are hard to track, and look dated.

A digital flipbook keeps your design but adds page-turning, instant loading, links and media. Here is how the formats compare:
| Capability | Static PDF | Printed Report | Flipbook |
|---|
| Mobile reading | Pinch and zoom | Not applicable | Responsive layout |
| Cost per additional reader | Free | $8 to $25 | Free |
| Embedded video and audio | No | No | Yes |
| Reader analytics | Limited | None | Page views and time on page (Professional plan) |
| Password protection | Basic | Not applicable | Yes |
| Easy updates after sending | No | No | Yes |
For a nonprofit that is already stretching a budget, the cost row matters most. You can reach 5,000 supporters with the same effort as 50.
💡 Pro tip: Put a short video message from a beneficiary on page two of your impact flipbook. Donors who watch it are far more likely to read the rest.
How to Create Either Report With Flipbooks AI
If you already have a designed PDF, you can have a shareable report in minutes. Here is the process.

Step-by-Step Tutorial
- Create an account. Go to Flipbooks AI and sign up. You can compare plans on the pricing page.
- Upload your PDF. Drag the file into the dashboard. The PDF to Flipbook Converter turns each page into a flippable spread with no watermarks.
- Customize the look. Add your logo, set brand colors, choose a page effect and a background that matches your campaign.
- Add multimedia. Embed a thank-you video, a short audio testimony or links to your donation page.
- Set privacy. Use password protection for board packets and unpublished annual reports, and keep the impact report public.
- Share it. Copy the direct link for emails, or use the Embed Flipbook on Website tool to place it on your donate page.
- Track results. On the Professional plan, analytics and lead generation show which pages donors read and who requested the full document.
Tools Built for Each Report
You can browse every flipbook tool to see which template fits your layout.
Design Tips That Help Donors Read
A designer working on the layout will make or break how either document is received.

For the Annual Report
- Use a clear table of contents with page links
- Keep financial tables in a consistent, readable font size
- Highlight three headline numbers on the first spread
- Use charts only when they simplify a table
For the Impact Report
- Lead with one human face and one headline number
- Use large, honest photography, not stock images
- Keep paragraphs to three sentences
- End each section with a simple "what this means for you" line
Common Mistakes in Both
- Too much jargon. Replace "capacity building" with what actually happened.
- No date range. Always state the period covered.
- No next step. Every report should end with a way to give, volunteer or ask questions.
Quick Checklist Before You Publish
| Check | Annual Report | Impact Report |
|---|
| Period and organization name on the first page | ✅ | ✅ |
| Audited or reviewed financials | ✅ | Optional summary |
| At least three measurable outcomes | Optional | ✅ |
| Beneficiary stories with consent | Optional | ✅ |
| Donor recognition list | ✅ | Optional |
| Clear donation call to action | ✅ | ✅ |
| Mobile preview tested | ✅ | ✅ |
Start Publishing Both Today
Donors do not want one report to do everything. They want a trustworthy annual report that proves the books are clean and an impact report that proves the work matters. Treat them as partners, release them at different moments, and make both easy to open on a phone.
Ready to build yours? Get started for free on Flipbooks AI, browse the full list of tools and templates, or compare pricing plans to choose what works for your team.



