Print is not dead, it just got a doorway. Every brochure, postcard and menu card that carries a QR code is now a tiny landing page launcher, and the numbers behind that behavior are worth studying before you approve your next print run. This article collects the QR code statistics print marketers should know in 2027, explains what they mean for real campaigns, and shows how to send scanners to a fast, trackable destination such as a flipbook built on Flipbooks AI.
💡 A note on the numbers: the figures below are rounded, directional benchmarks drawn from widely cited industry surveys and typical campaign results. Treat them as planning ranges, then replace them with your own scan data as soon as you have it.
Why QR Codes Stuck Around
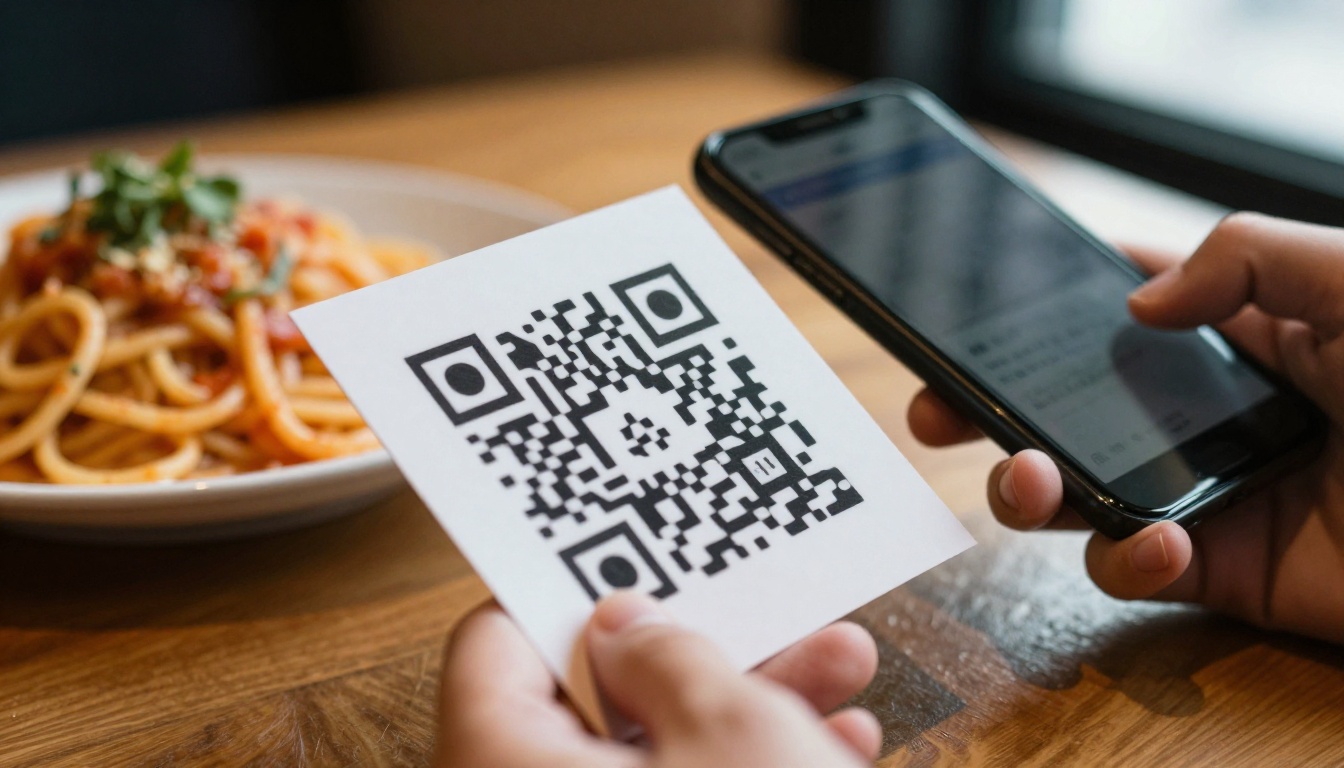
QR codes spent years as a punchline. Then restaurants, airlines and event organizers made them normal, and phone cameras began reading them natively with no app needed. That habit did not disappear when the emergency reasons did.
Three shifts explain the staying power:
- Native camera support. Both major mobile operating systems read codes straight from the camera view.
- Familiarity. Most adults in developed markets have scanned at least one code, and many scan monthly.
- Cheap tracking. A dynamic code can be changed after printing and measured like any other link.
For print marketers, this means paper is finally measurable. A flyer used to be a guess. Now it can be a funnel with a visible top.
The Adoption Curve
Surveys across recent years have put US scanning households well above 80 million, with total scanners in the US reported in the range of 100 million or more. Global usage keeps climbing, and the steepest growth has come from people aged 25 to 54, which is exactly the buying audience for most B2B and B2C print.
The Core QR Code Statistics
Here is a quick reference table you can paste into a planning deck. Ranges are intentionally wide because results change by industry, offer and placement.
| Metric | Typical Range | What It Tells You |
|---|
| Adults who scanned a code in the past month | 40% to 60% | Scanning is routine, not novel |
| Scan rate on well-placed print | 1% to 5% | A small share of readers act, so volume matters |
| Share of scans from smartphones | Above 95% | Design the landing page for mobile first |
| Share of scans on iOS vs Android | Roughly 50/50, varies by region | Test on both |
| Scans that happen on weekday evenings | Highest daily share | Print for the couch, not just the commute |
| Codes with a clear call to action vs none | 2x to 4x more scans with a prompt | Never print a naked code |
⚠️ A scan rate of 1% sounds tiny. On a 50,000-piece mailing it is 500 qualified, self-selected visitors who raised their hand on their own phone.
Where People Actually Scan
Location drives behavior more than design does. People scan when they are already holding the material and already curious.
Top Scan Environments
- At home, with a catalog, mailer or magazine on the table.
- In restaurants and cafes, using table cards and menus.
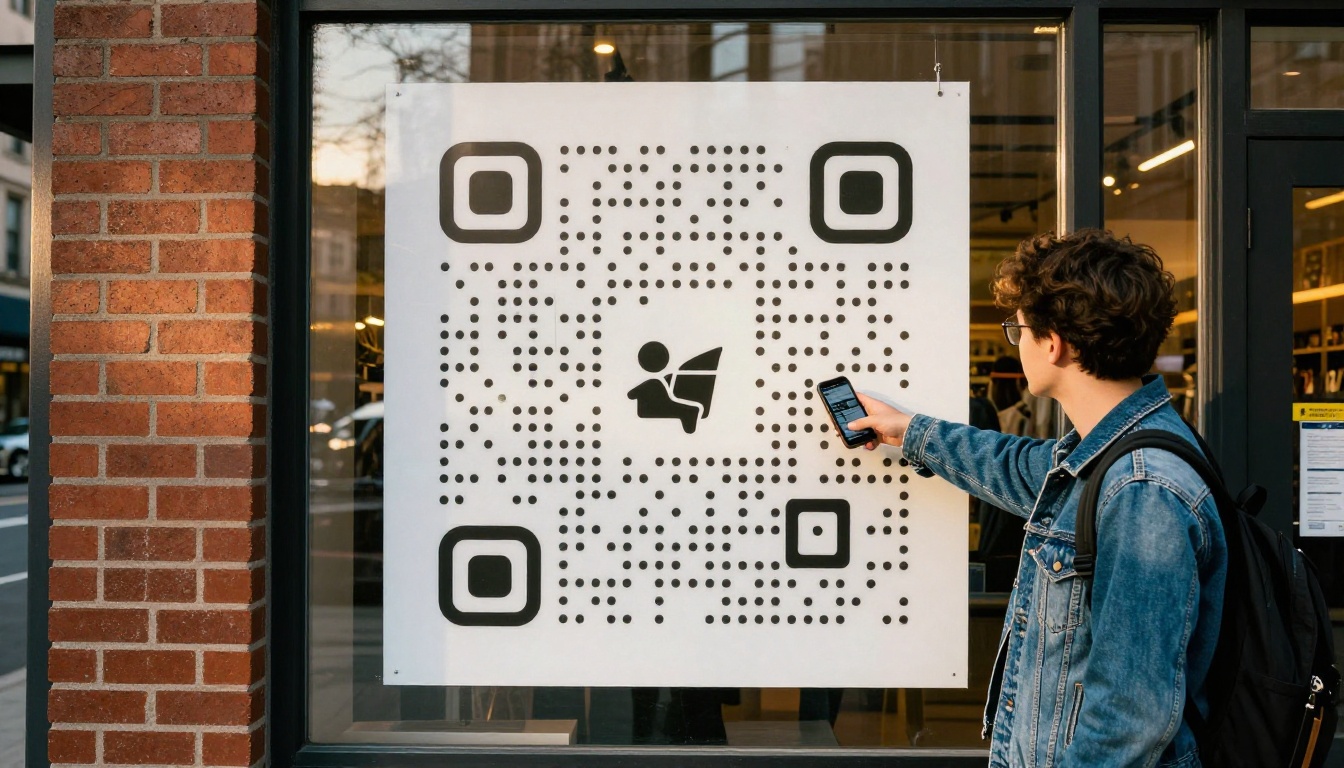
- In retail stores, at shelf talkers, packaging and window posters.
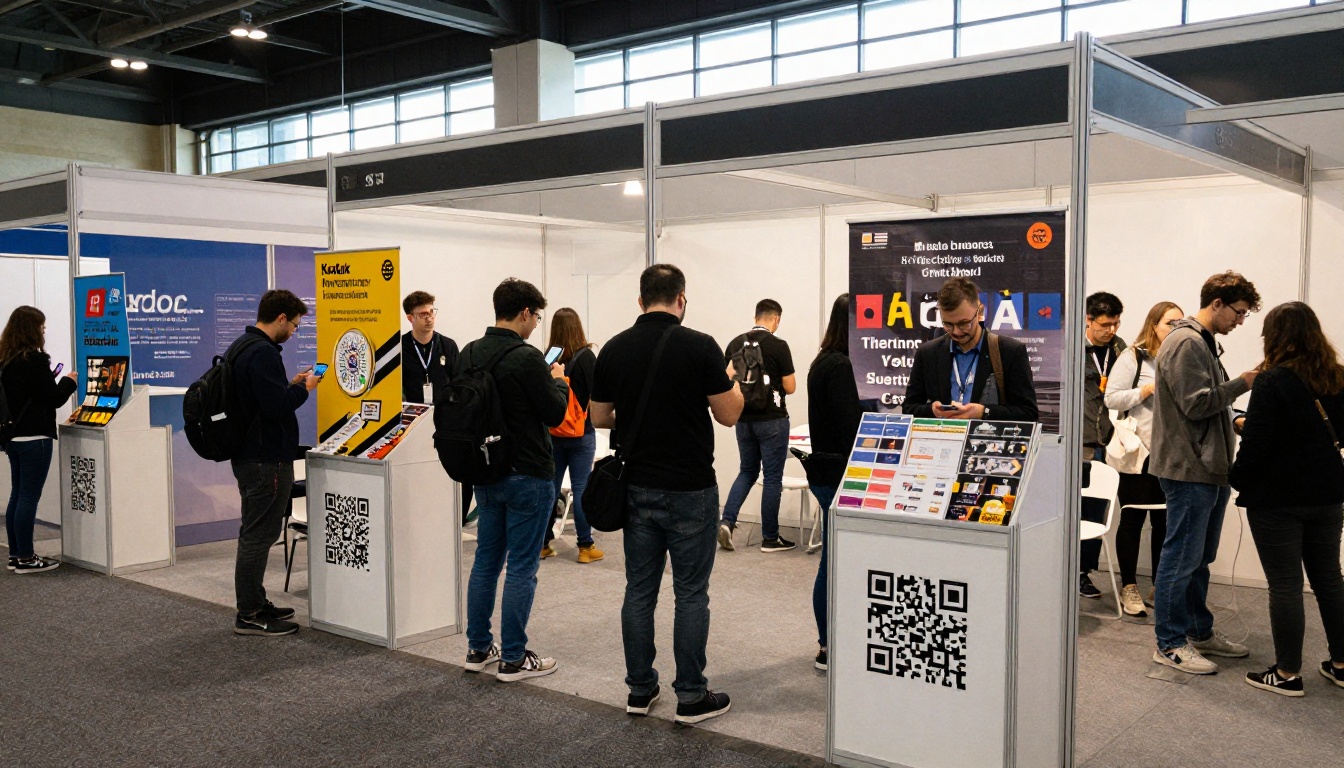
- At events and trade shows, from banners, badges and brochures.
- In transit, from posters and print ads.
Home scanning is the quiet winner for direct mail and catalogs, because there is no time pressure and the reader can finish a full checkout or form.
Placement Within the Piece
On a printed page, the code's position changes results more than most teams expect.
| Placement | Relative Scan Performance | Best For |
|---|
| Back cover, bottom right | High | Brochures, catalogs |
| Next to a specific product | Very high | Product catalogs, lookbooks |
| Front of a postcard | High | Direct mail with one offer |
| Inside fold, no label | Low | Avoid |
| Footer of a long page | Low to medium | Reference material only |
Not every format earns the same return. Based on typical campaign reports, here is how common print pieces compare.
| Print Format | Scan Intent | Landing Page Match |
|---|
| Product catalog | High, product-level | Digital catalog with product links |
| Direct mail postcard | Medium to high | Single-offer page |
| Restaurant table card | High, immediate | Digital menu |
| Brochure | Medium | Interactive brochure or flipbook |
| Magazine ad | Low to medium | Campaign page with a clear offer |
| Packaging | Medium | Manual, recipe or registration page |
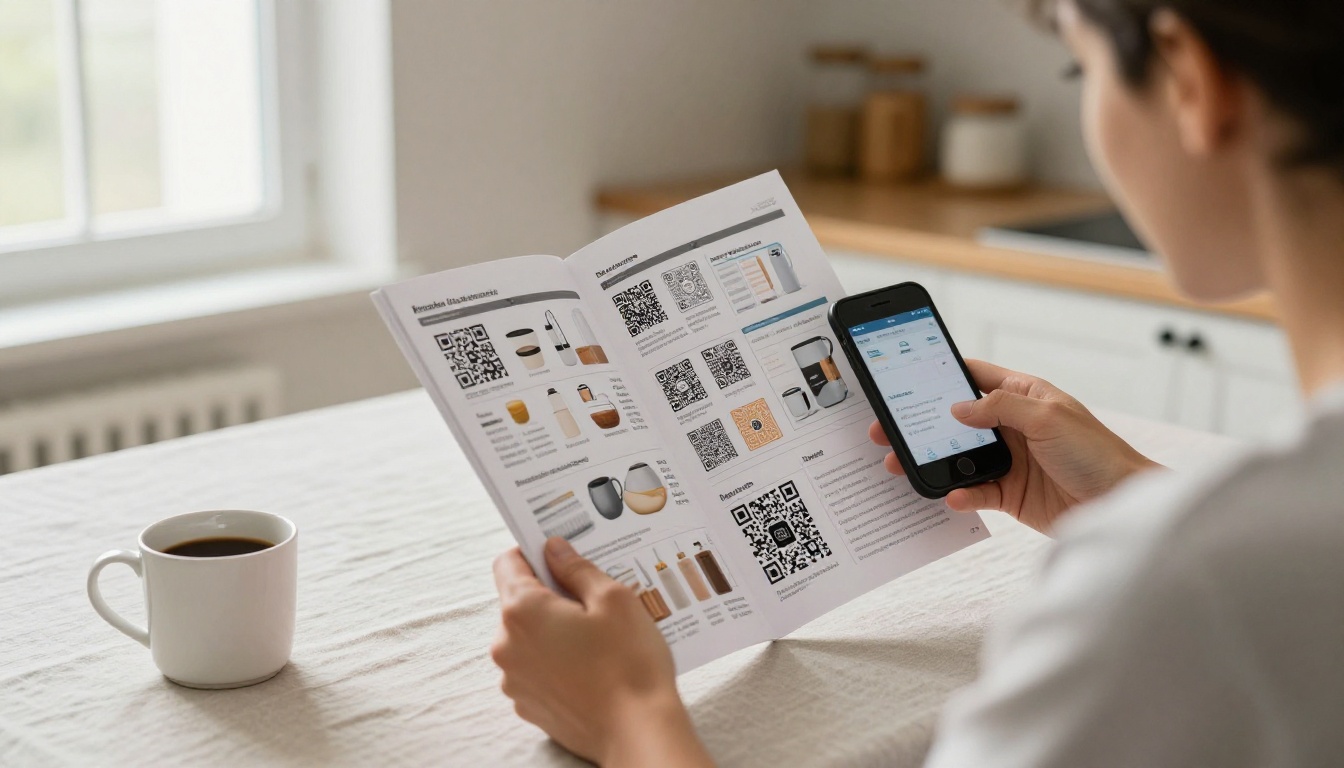
Catalogs and brochures deserve special attention. A reader holding a 24-page catalog is a warm lead. Pointing the code to an interactive version of that same catalog, with clickable products, keeps the reader inside one consistent experience. A Product Catalog Generator or a Brochure Flipbook Maker fits this exact job.
Design Choices That Move the Numbers
Scan statistics are shaped by small design decisions. These rules show up again and again in campaign post-mortems.
Size and Contrast
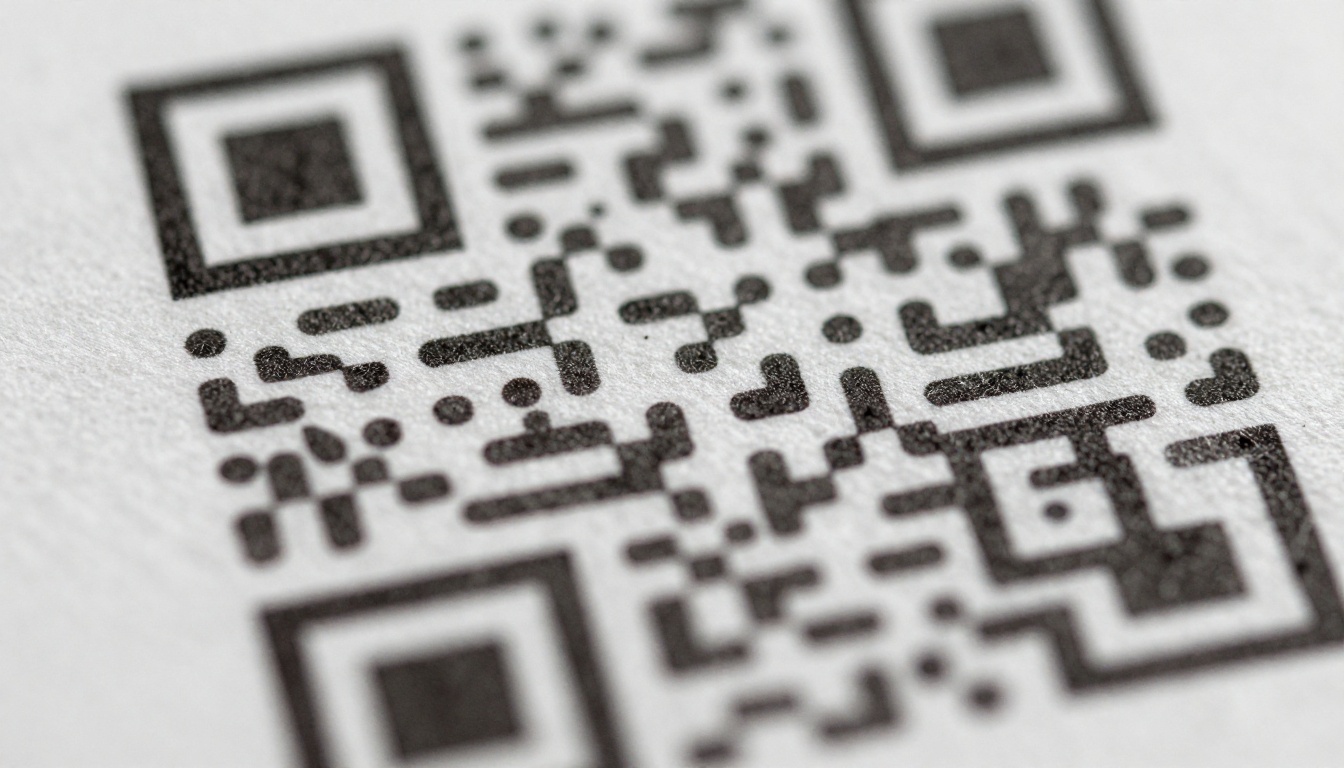
A code should be at least 2 cm by 2 cm (about 0.8 inches) for close-range reading, and larger for posters. As a rough rule, scanning distance should be about ten times the code width. Dark code on a light background beats every stylized alternative. Inverted or low-contrast codes fail more often.
Quiet Zone and Print Quality
Leave a blank margin of at least four modules around the code. Print on matte stock when possible, since glossy paper reflects light and can make scanning harder under overhead lamps.
A Call to Action Beside the Code
Codes with a short prompt consistently outperform codes without one. Compare these:
- Weak: no text at all.
- Better: "Scan to see the menu."
- Best: "Scan for 10% off your first order."
✅ Best practice: state the benefit in six words or fewer and name what the phone will open.
Frame, Logo and Color
Light branding inside or around a code can lift trust, but heavy artwork reduces reliability. Test every printed proof with at least three phones before sending files to the printer.
What Happens After the Scan
This is where most campaigns lose the sale. Scan statistics only matter if the next screen works.
Mobile Load Speed
Most people abandon a page that takes more than a few seconds to load. A heavy PDF download is the worst possible destination: it is slow, it is awkward to zoom, and it gives you no data. A lightweight flipbook opens instantly, flips with a swipe, and remains readable on a small screen.
Destination Comparison
| Destination | Mobile Experience | Trackable | Editable After Print |
|---|
| Raw PDF link | Poor, pinch to zoom | Barely | No |
| Generic website homepage | Mixed | Yes | Yes |
| Dedicated landing page | Good | Yes | Yes |
| Interactive flipbook | Very good, page by page | Yes, with analytics | Yes, with dynamic codes |
How to Connect a Printed Piece to a Flipbook
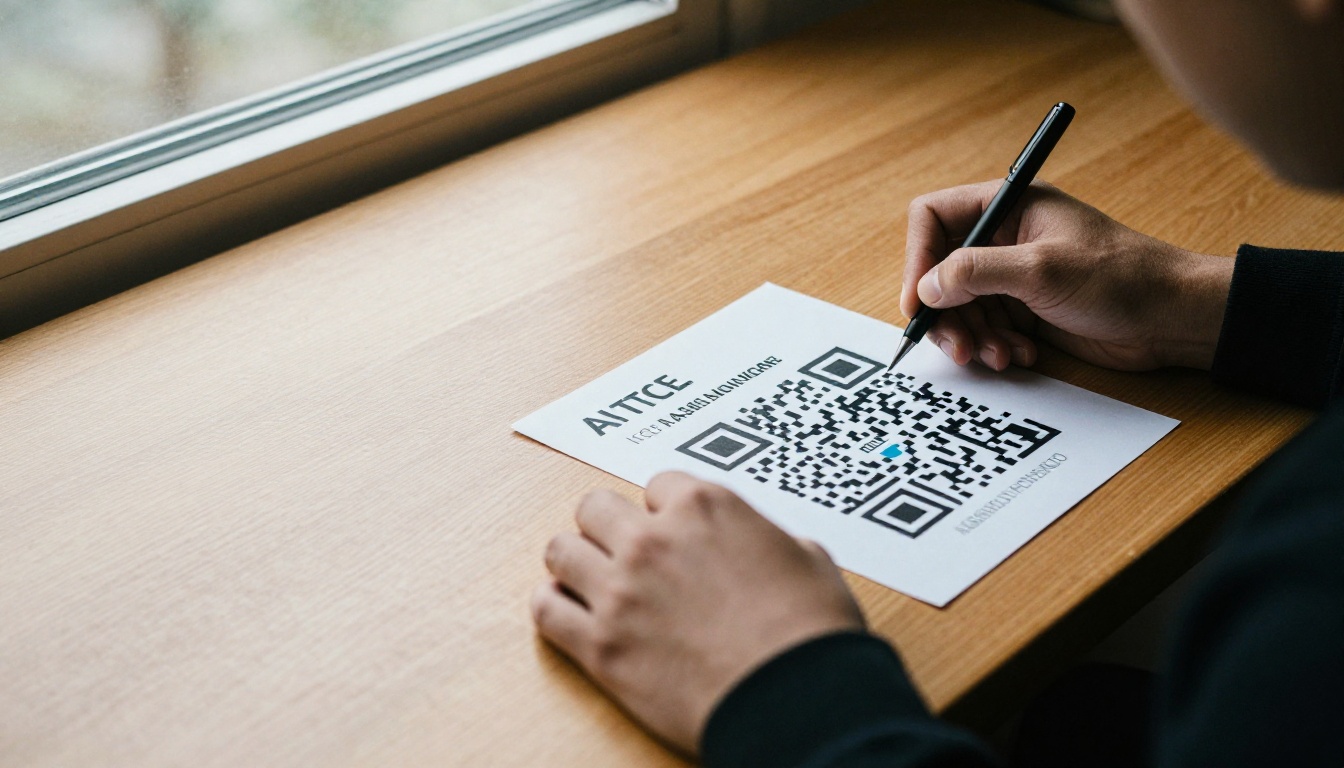
If your printed brochure or catalog already exists as a PDF, you can turn it into a mobile-friendly destination in minutes. Here is the workflow.
- Create your account. Open Flipbooks AI and sign in.
- Upload the PDF. Use the PDF to Flipbook Converter. The pages convert into a swipeable flipbook with page-turn effects.
- Add your branding. Set colors, add your logo and remove clutter. There are no watermarks on your flipbooks.
- Add multimedia. Embed a short video or audio clip on the pages that need extra explanation.
- Set sharing options. Copy the direct link, grab an embed code, or add password protection for private content. See the Embed Flipbook on Website tool for site placement.
- Generate the QR code. Point a dynamic QR code at the flipbook link and print it with a clear call to action.
- Review the stats. On the Professional plan, use analytics and lead generation to see which pages hold attention and who opted in.
💡 Pro tip: use a dynamic code. If you reprint next season with a new catalog, you only update the destination. The printed code stays valid.
The responsive design means the same flipbook looks right on a phone, a tablet and a desktop, and offline downloads let readers keep a copy for later.
Real-World Use Cases
Numbers are easier to trust when they attach to a scene. These examples show how the statistics play out.
- A restaurant places table cards with the line "Scan to see tonight's menu." The code opens a flipbook built with the Restaurant Menu Creator. Changing a dish takes seconds, with no reprint.
- A real estate agency prints window posters and mailers. Each code opens a property brochure made with the Real Estate Brochure Creator, and lead generation captures the viewer's email.
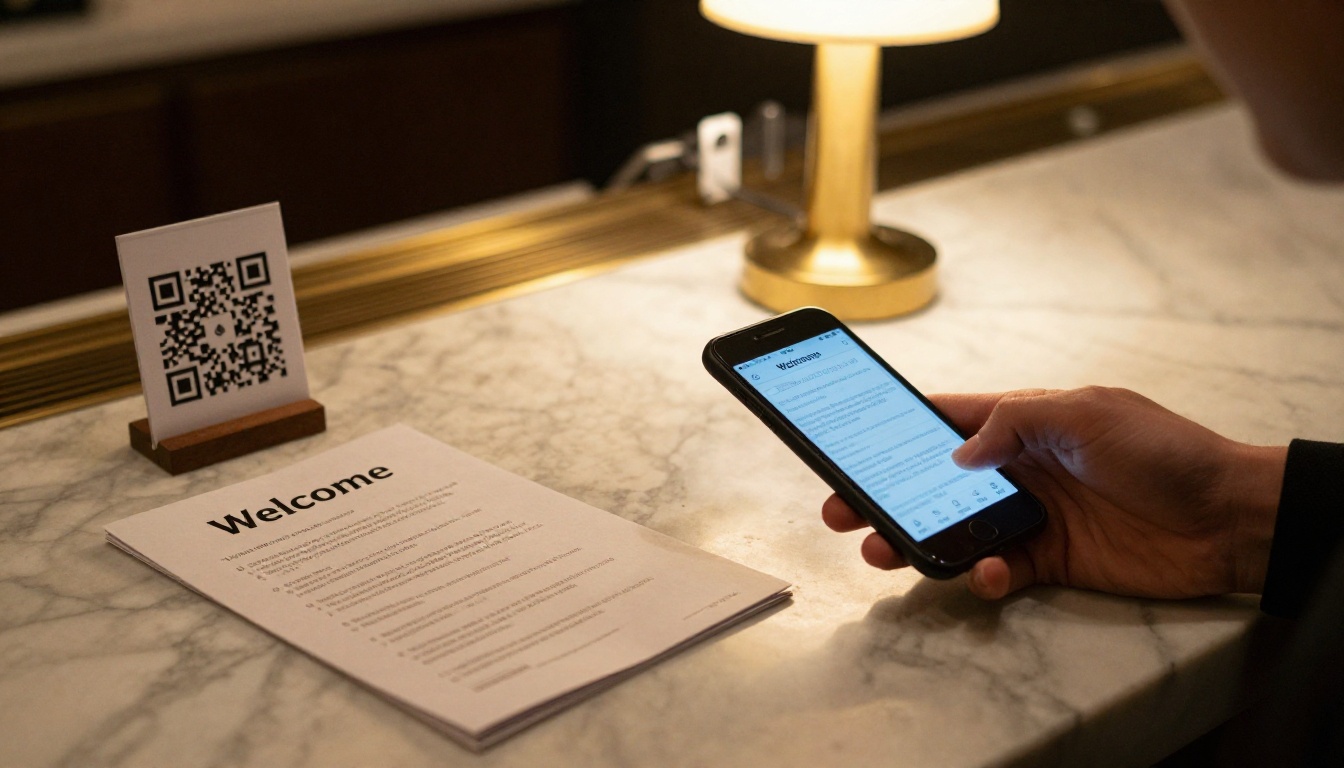
- A hotel leaves a welcome card at reception. The code opens a Hotel Brochure with spa hours, dining options and local routes.
- A fashion retailer mails a seasonal piece. A code beside each outfit opens a lookbook built with the Interactive Lookbook Designer.
Common Mistakes That Skew Your Data
A messy setup creates misleading statistics. Watch for these.
- Using one code on every piece. You cannot compare formats if all scans look identical. Give each placement its own tracking tag.
- Static codes with no edit path. One typo or expired page and the whole print run is stuck.
- No mobile test. If you only open the page on a desktop, you miss broken layouts.
- Hiding the code in a corner with no prompt. Visibility is half the result.
- Sending scans to a login wall. Every extra step cuts completion.
Benchmarks to Track
| Metric | How to Calculate | Healthy Starting Target |
|---|
| Scan rate | Scans divided by pieces distributed | 1% to 3% |
| Page depth | Average pages viewed per visit | 4 or more |
| Lead capture rate | Form submissions divided by visits | 5% to 15% |
| Repeat scans | Visitors who scan twice or more | Rising month over month |
What to Watch in 2027
A few trends are shaping how print teams plan the coming year:
- Payment and ordering via code keeps spreading beyond restaurants into retail and events.
- Privacy-friendly tracking is replacing cookie-heavy methods, so first-party scan data becomes more valuable.
- Personalized codes on direct mail, with a unique code per recipient, link a printed piece to a named response.
- Interactive destinations are replacing static PDFs, because readers expect motion, video and quick navigation.
The takeaway for planning: treat every code as an experiment, label it, and measure it.
Turn Paper Into a Trackable Channel
The statistics point in one direction. People scan, they scan on phones, and they expect the next screen to be fast and useful. Your job is to give them that screen.
Ready to build one? Get started for free on Flipbooks AI and convert your next PDF into a mobile flipbook. Browse all available tools and templates to find the right fit for your catalog, menu or brochure, and compare pricing plans to see where analytics and lead generation come in. When you are set to commit, you can also pick a plan after signing in.



