Page count is a quiet saboteur. You spend weeks building a beautiful digital publication, only to find that most readers abandon it before reaching page five. The data is consistent across industries: when a flipbook or PDF runs too long, read rates collapse. Understanding why this happens, and what you can do about it, is one of the highest-leverage improvements you can make to your digital publishing strategy. Flipbooks AI gives you the tools to control page depth, track reader behavior, and trim your content to the exact length that keeps people reading.
What Read Rate Actually Tells You
Read rate is the percentage of your total publication that the average reader actually consumes. If you publish a 40-page catalog and the average reader reaches page eight before closing it, your read rate is 20%. That number matters far more than impressions or opens.

The metric most publishers ignore
Most publishers obsess over open rates. Someone clicked the link, so the job is done. But opening a publication and reading it are completely different behaviors. A reader who opens your catalog and leaves after page two is functionally the same as a reader who never opened it at all, from a conversion perspective. Read rate cuts through that illusion and shows you what readers actually experienced.
High open rates with low read rates point to a single problem: the content is not holding attention long enough to matter. And in most cases, page count is the reason.
Why drop-off data reveals the truth
When you break down read rate by page, the pattern is almost always the same. Readers stay absorbed for the first few pages, then drop off sharply around pages five through ten, and then plateau. Very few readers reach the back half of long publications. This is not a content quality problem in most cases. It is a volume problem. Readers self-regulate by quitting when the perceived effort of finishing feels too high relative to the value they expect to get.
💡 Pro tip: If your analytics show consistent drop-off at a specific page number, that page is a signal, not the cause. The cause is almost always that the reader saw too many pages ahead and quit before reaching it.
Why Page Count Is the Silent Killer
There is a well-documented psychological effect called effort forecasting. Before committing to a task, people estimate how much effort it will require. If that estimate exceeds their available attention budget, they disengage immediately or shortly after starting. Digital publications are especially vulnerable to this effect because most formats show readers exactly how many pages remain.

The psychology of a long scroll
When a reader opens a publication and sees 60 pages, they make an immediate decision. The cognitive load of processing that information is weighed against the reward they expect. For most casual readers, 60 pages reads as a commitment they did not sign up for. They either skim rapidly, which dilutes your message, or they close the tab entirely.
This is not laziness. It is rational attention management. Human attention is finite and readers allocate it carefully. Publications that respect that constraint get read. Those that ignore it get abandoned.
Mobile readers have less patience
The mobile experience makes this problem significantly worse. On a small screen, even a 20-page document feels long. Mobile readers are often in transit, distracted, or browsing in short windows. They have even less tolerance for volume than desktop users. Since mobile now accounts for the majority of digital content consumption, designing for mobile attention spans is not optional.
⚠️ Warning: If your publication was designed on desktop, it almost certainly feels longer on mobile. Page density, text size, and scroll behavior all change on smaller screens.
What the Numbers Say
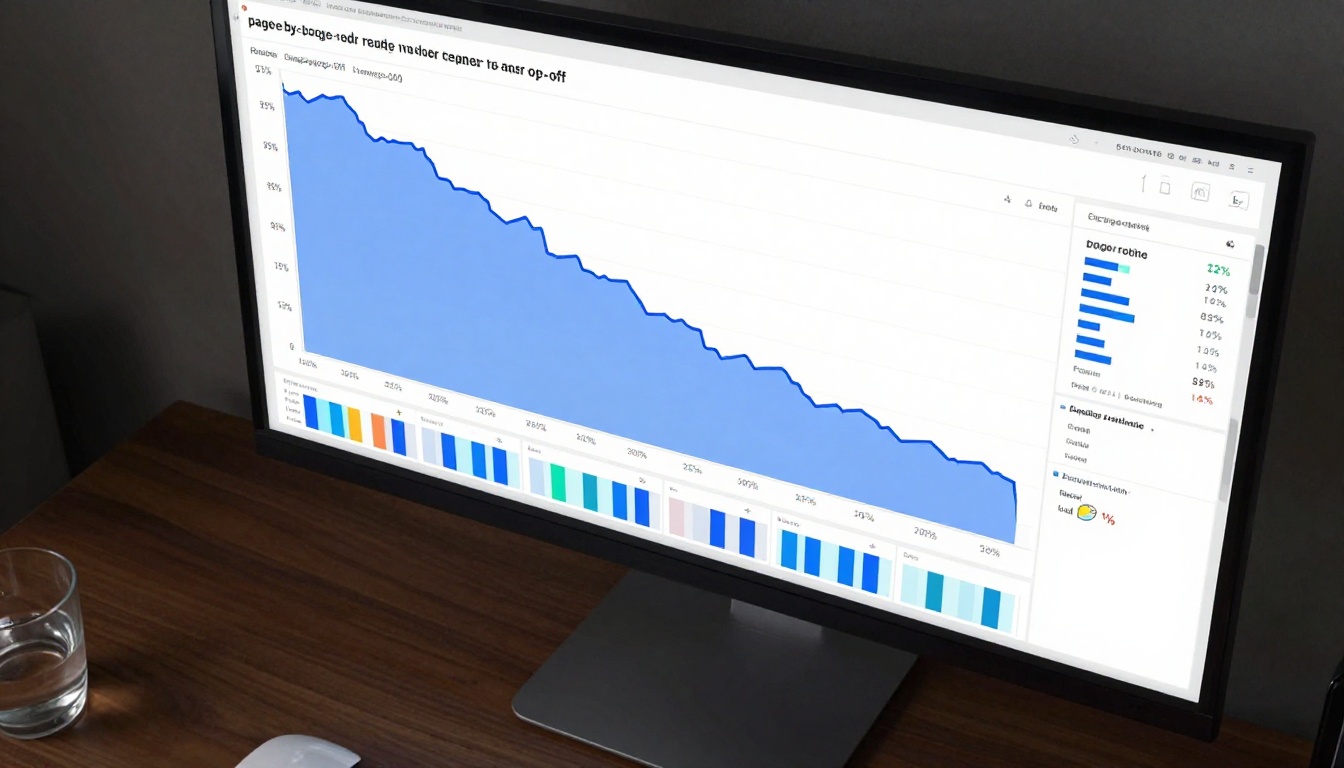
Reader behavior data across digital publishing platforms consistently shows that shorter publications outperform longer ones in read completion. Here is how average completion rates break down by page count:
| Page Count | Avg. Completion Rate |
|---|
| 1-10 pages | 72-88% |
| 11-20 pages | 45-60% |
| 21-40 pages | 22-38% |
| 41-80 pages | 10-20% |
| 80+ pages | Under 10% |
These numbers shift depending on content type and audience commitment level, but the direction is always the same: more pages, lower completion.
Average completion rates by content type
Not all publications are equal. A technical manual has a different audience than a lifestyle magazine. But even within categories, page count creates a ceiling on completion.
| Content Type | Ideal Page Range | Why |
|---|
| Product catalog | 16-32 pages | Buyers scan, not read |
| Digital magazine | 20-40 pages | Browsing behavior, not deep reading |
| Company report | 12-24 pages | Executive summaries outperform full reports |
| Training manual | 8-16 pages per module | Chunked content beats monoliths |
| Restaurant menu | 4-12 pages | Decision fatigue sets in fast |
| Event program | 4-8 pages | Time-constrained audience |
The sweet spot nobody talks about
The sweet spot is not about hitting a minimum. It is about publishing only what earns its place. The best-performing digital publications share one characteristic: every page either informs, converts, or entertains. Pages that do none of those three things are dead weight that actively lowers your read rate by raising the perceived cost of finishing.
✅ Best practice: Before publishing, ask of every page: "If a reader skipped this, would they miss anything that affects their decision or experience?" If the answer is no, cut it.
Five Content Types That Suffer Most
Some publication formats are especially sensitive to page count. These are the categories where over-publishing does the most damage.

Product catalogs and the scroll trap
A 200-product catalog sounds impressive. In practice, it is a read rate disaster. Buyers do not browse product catalogs like books. They scan for specific items, compare a handful of options, and decide. When a catalog runs too long, buyers quit before reaching the products that would have converted them.
The fix is segmentation. Instead of one massive catalog, publish several focused ones. A furniture retailer might publish separate flipbooks for living room, bedroom, and outdoor collections. Each one stays under 30 pages, stays relevant to the viewer's intent, and gets read all the way through. The Digital Catalog Maker on Flipbooks AI makes this easy to manage, with no watermarks and unlimited flipbooks on Standard plans.
Annual reports that nobody finishes
Annual reports are notorious for length. Legal and compliance requirements push them long, and design teams compensate by adding visual flair that adds even more pages. The result is a publication that looks impressive in print but gets abandoned on screen.
The solution is splitting the report into audience-specific versions. A public-facing highlights version can run 12-16 pages. The full statutory report can remain long for download but should never be your primary digital format. Use the Annual Report Creator to build the short version, and link to the full PDF for those who specifically need it.
Digital magazines that overstay their welcome
Magazine editors often pad issues to hit a page count that feels substantial. The logic works in print, where physical weight creates perceived value. Online, it works against you. Readers of digital magazines have no patience for filler content, and they know exactly when they are reading it.
A 30-page digital magazine that is 30 pages of genuinely interesting content will outperform a 60-page magazine every time. Use the E-Magazine Publishing Tool to create tight, well-designed issues that readers actually finish.
Training materials and cognitive overload
Learning content is particularly vulnerable to length problems. When a training module runs too long, learners do not absorb information more slowly. They switch off. The research on instructional design consistently shows that shorter modules with clear structure produce better retention than exhaustive single-sitting materials.
Chunk training content into modules of 8-12 pages maximum. The Training Manual Flipbook tool supports multi-document publishing, so you can create a series of short modules instead of one overwhelming document.
Lookbooks that lose momentum
A fashion or lifestyle lookbook should feel curated, not complete. The strongest lookbooks leave readers wanting more. When they run past 30-40 pages, the editorial feeling evaporates and the experience starts to feel like a warehouse, not a boutique. Use the Interactive Lookbook Designer to build tight, high-impact collections.
How to Cut Pages Without Losing Value
Knowing that your publication is too long is the easy part. Knowing what to cut is harder. Here is a systematic approach that keeps the value and removes the volume.
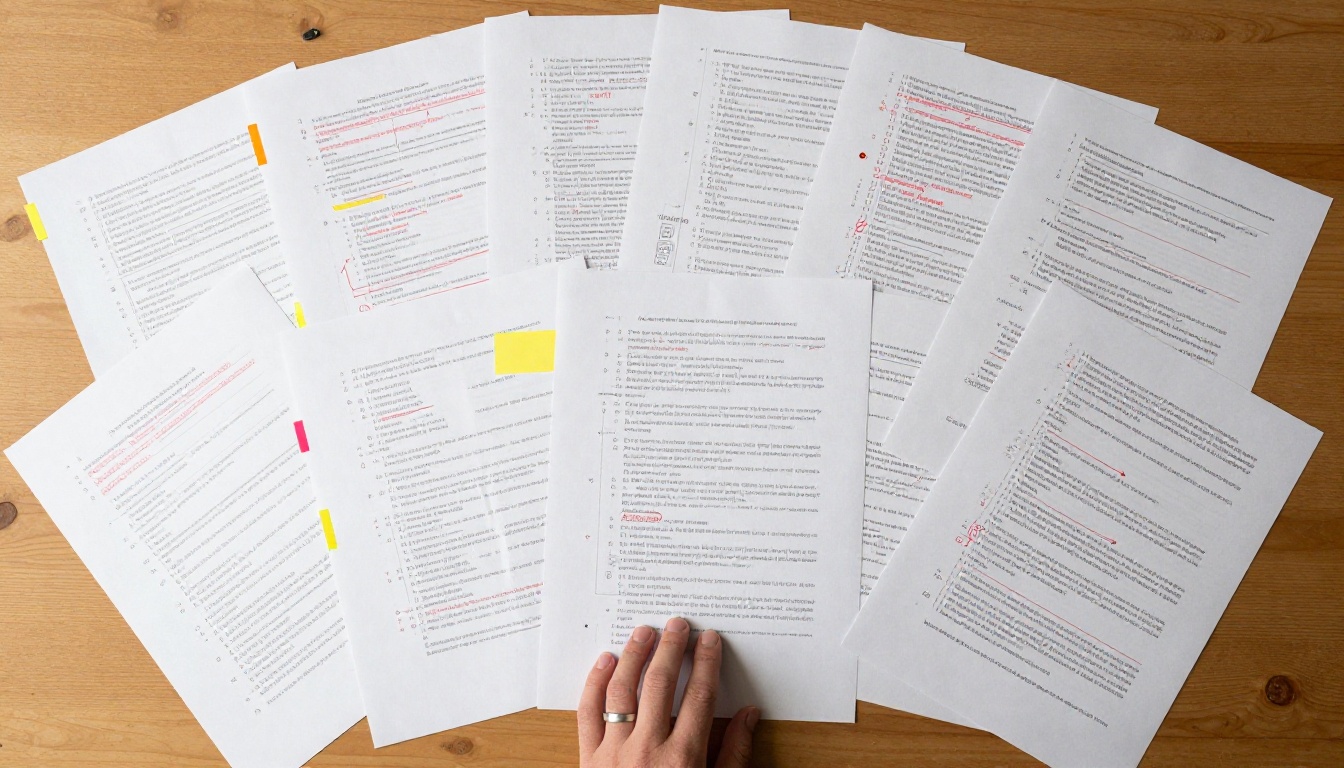
Audit your content ruthlessly
Start with a page-by-page evaluation using a simple scoring system. For each page, ask three questions:
- Does this page contain information a reader would miss if it were removed?
- Does this page drive the reader toward a decision or next step?
- Does this page contribute to the overall narrative or visual experience?
Pages that score zero on all three questions are candidates for removal. Pages that score one out of three should be consolidated with adjacent content. Pages that score two or three earn their place.

Visual compression that works
Many publications are long because of inefficient visual design, not because of content volume. Common culprits include:
- Full-page transitions: A decorative transition page between sections adds one page with zero information value.
- Oversized white space: White space is good design, but an entire half-page of empty margin is a page tax.
- Repeated headers and footers: Branding elements that occupy a quarter of every page reduce information density significantly.
- Single-product pages: Presenting one product per page in a catalog doubles or triples the page count with no reader benefit.
Tighter layouts, grid-based product spreads, and consolidated sections can often cut a 60-page document to 30 pages with no loss of information.
Split rather than shorten
Sometimes the content genuinely needs the space it occupies, but it is serving multiple audiences. Before cutting, ask whether segmentation is the better answer. A single 80-page catalog might work better as three 25-page catalogs organized by product category, audience, or use case. Readers get a shorter, more relevant experience. You get better read rates across all three.
How to Track and Fix This with Flipbooks AI
Flipbooks AI includes built-in analytics on its Professional plan that makes read rate optimization concrete rather than theoretical. Here is how to put it to work.

Step 1: Upload your PDF
Convert your existing document using the PDF to Flipbook Converter. Upload your PDF and Flipbooks AI creates a fully interactive flipbook in seconds. No design tools required.
Step 2: Publish and share
Share your flipbook via direct link, embed it on your website using the Embed Flipbook on Website tool, or send it via email. The platform supports password protection for private content and custom branding with no watermarks on Standard plans and above.
Step 3: Check your analytics
After your publication has been live for a few days, open the analytics dashboard. The Professional plan tracks:
- Page-by-page reader progression
- Average session depth
- Time spent per page
- Lead generation form completions
Look for the page where the drop-off rate spikes. That is your first cut target.
Step 4: Revise and re-publish
Make your cuts, re-upload the revised PDF, and republish. Flipbooks AI preserves your sharing link and embed code, so all existing placements update automatically. No need to redistribute links.
Step 5: Compare the results
Run both versions and compare read rate data over a 30-day window. Most publishers see a 20-40% improvement in completion rates after their first round of page count reduction.
💡 Pro tip: Start with a 20% page reduction. It is almost always enough to produce a measurable improvement without requiring a full content overhaul.

The Business Case for Shorter Publications
This is not just a design argument. The numbers make it plain.
| Metric | Long Publication | Short Publication |
|---|
| Read completion rate | 15-25% | 55-75% |
| Time on page | Low (skimming) | High (reading) |
| CTA click-through | 1-3% | 5-12% |
| Lead generation | Low | High |
| Return visitor rate | Low | Moderate |
A publication that gets read fully is a publication that has the chance to convert. Every page a reader does not reach is a call to action they never saw, a product they never considered, and a relationship that never formed. Cutting page count is not about doing less. It is about getting more from every page you keep.
✅ Best practice: Set a maximum page count policy for each content type in your organization before design begins. Constraints imposed at the design stage are far easier to maintain than cuts made after content is already built.
Start Measuring What Readers Actually Read
If you have active publications and have never looked at read rate data, start there. Pull up your analytics, find your drop-off page, and begin a content audit this week. The improvement in read rates is usually visible within days of re-publishing a trimmed version.

If you do not yet have analytics on your publications, that is the first problem to solve. Get started with Flipbooks AI and access the Professional plan's analytics tools to start collecting real reader behavior data. Without data, you are optimizing based on assumptions. With data, every decision you make about length, structure, and content priority is grounded in how actual readers behave.
Shorter publications are not a compromise. They are the standard that high-performing digital publishers already operate by. Every page should earn its place or it should not be there.
Create your first optimized flipbook and start measuring what your readers actually consume. Compare pricing plans to find the tier that includes the analytics features your strategy depends on. Browse all flipbook tools to find the right format for your specific use case.



